New Zealand Sea Level Rise
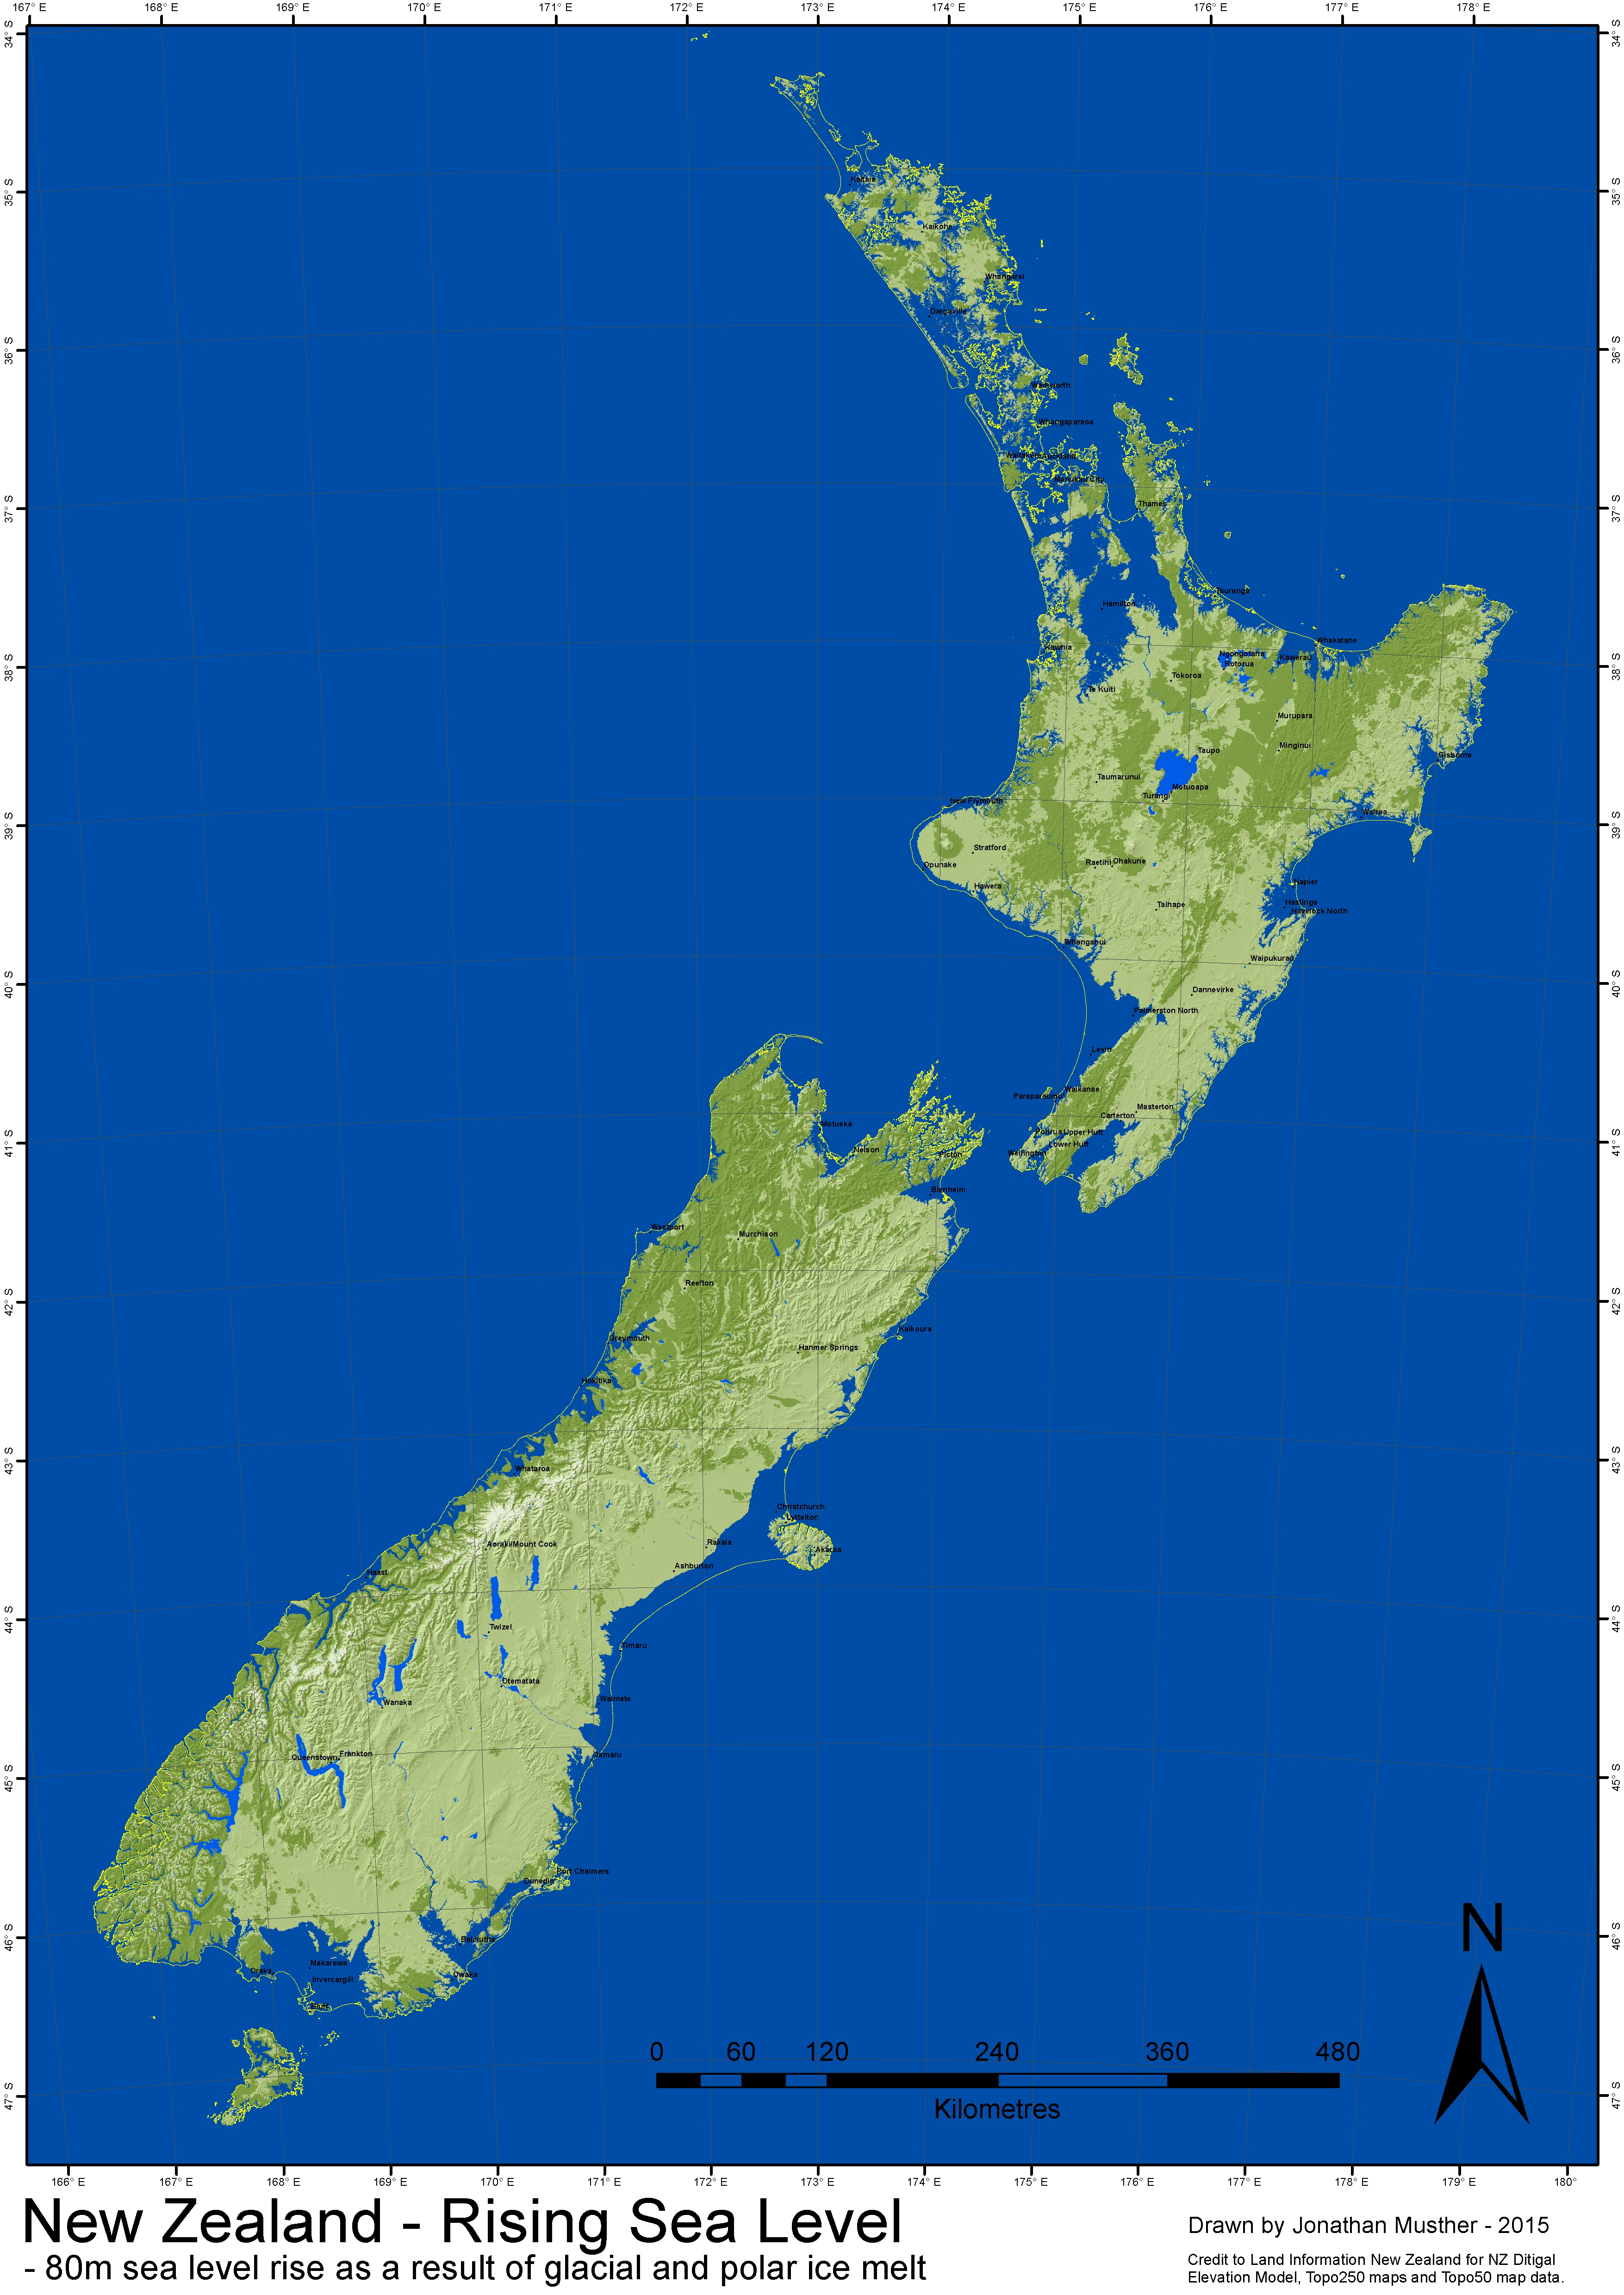
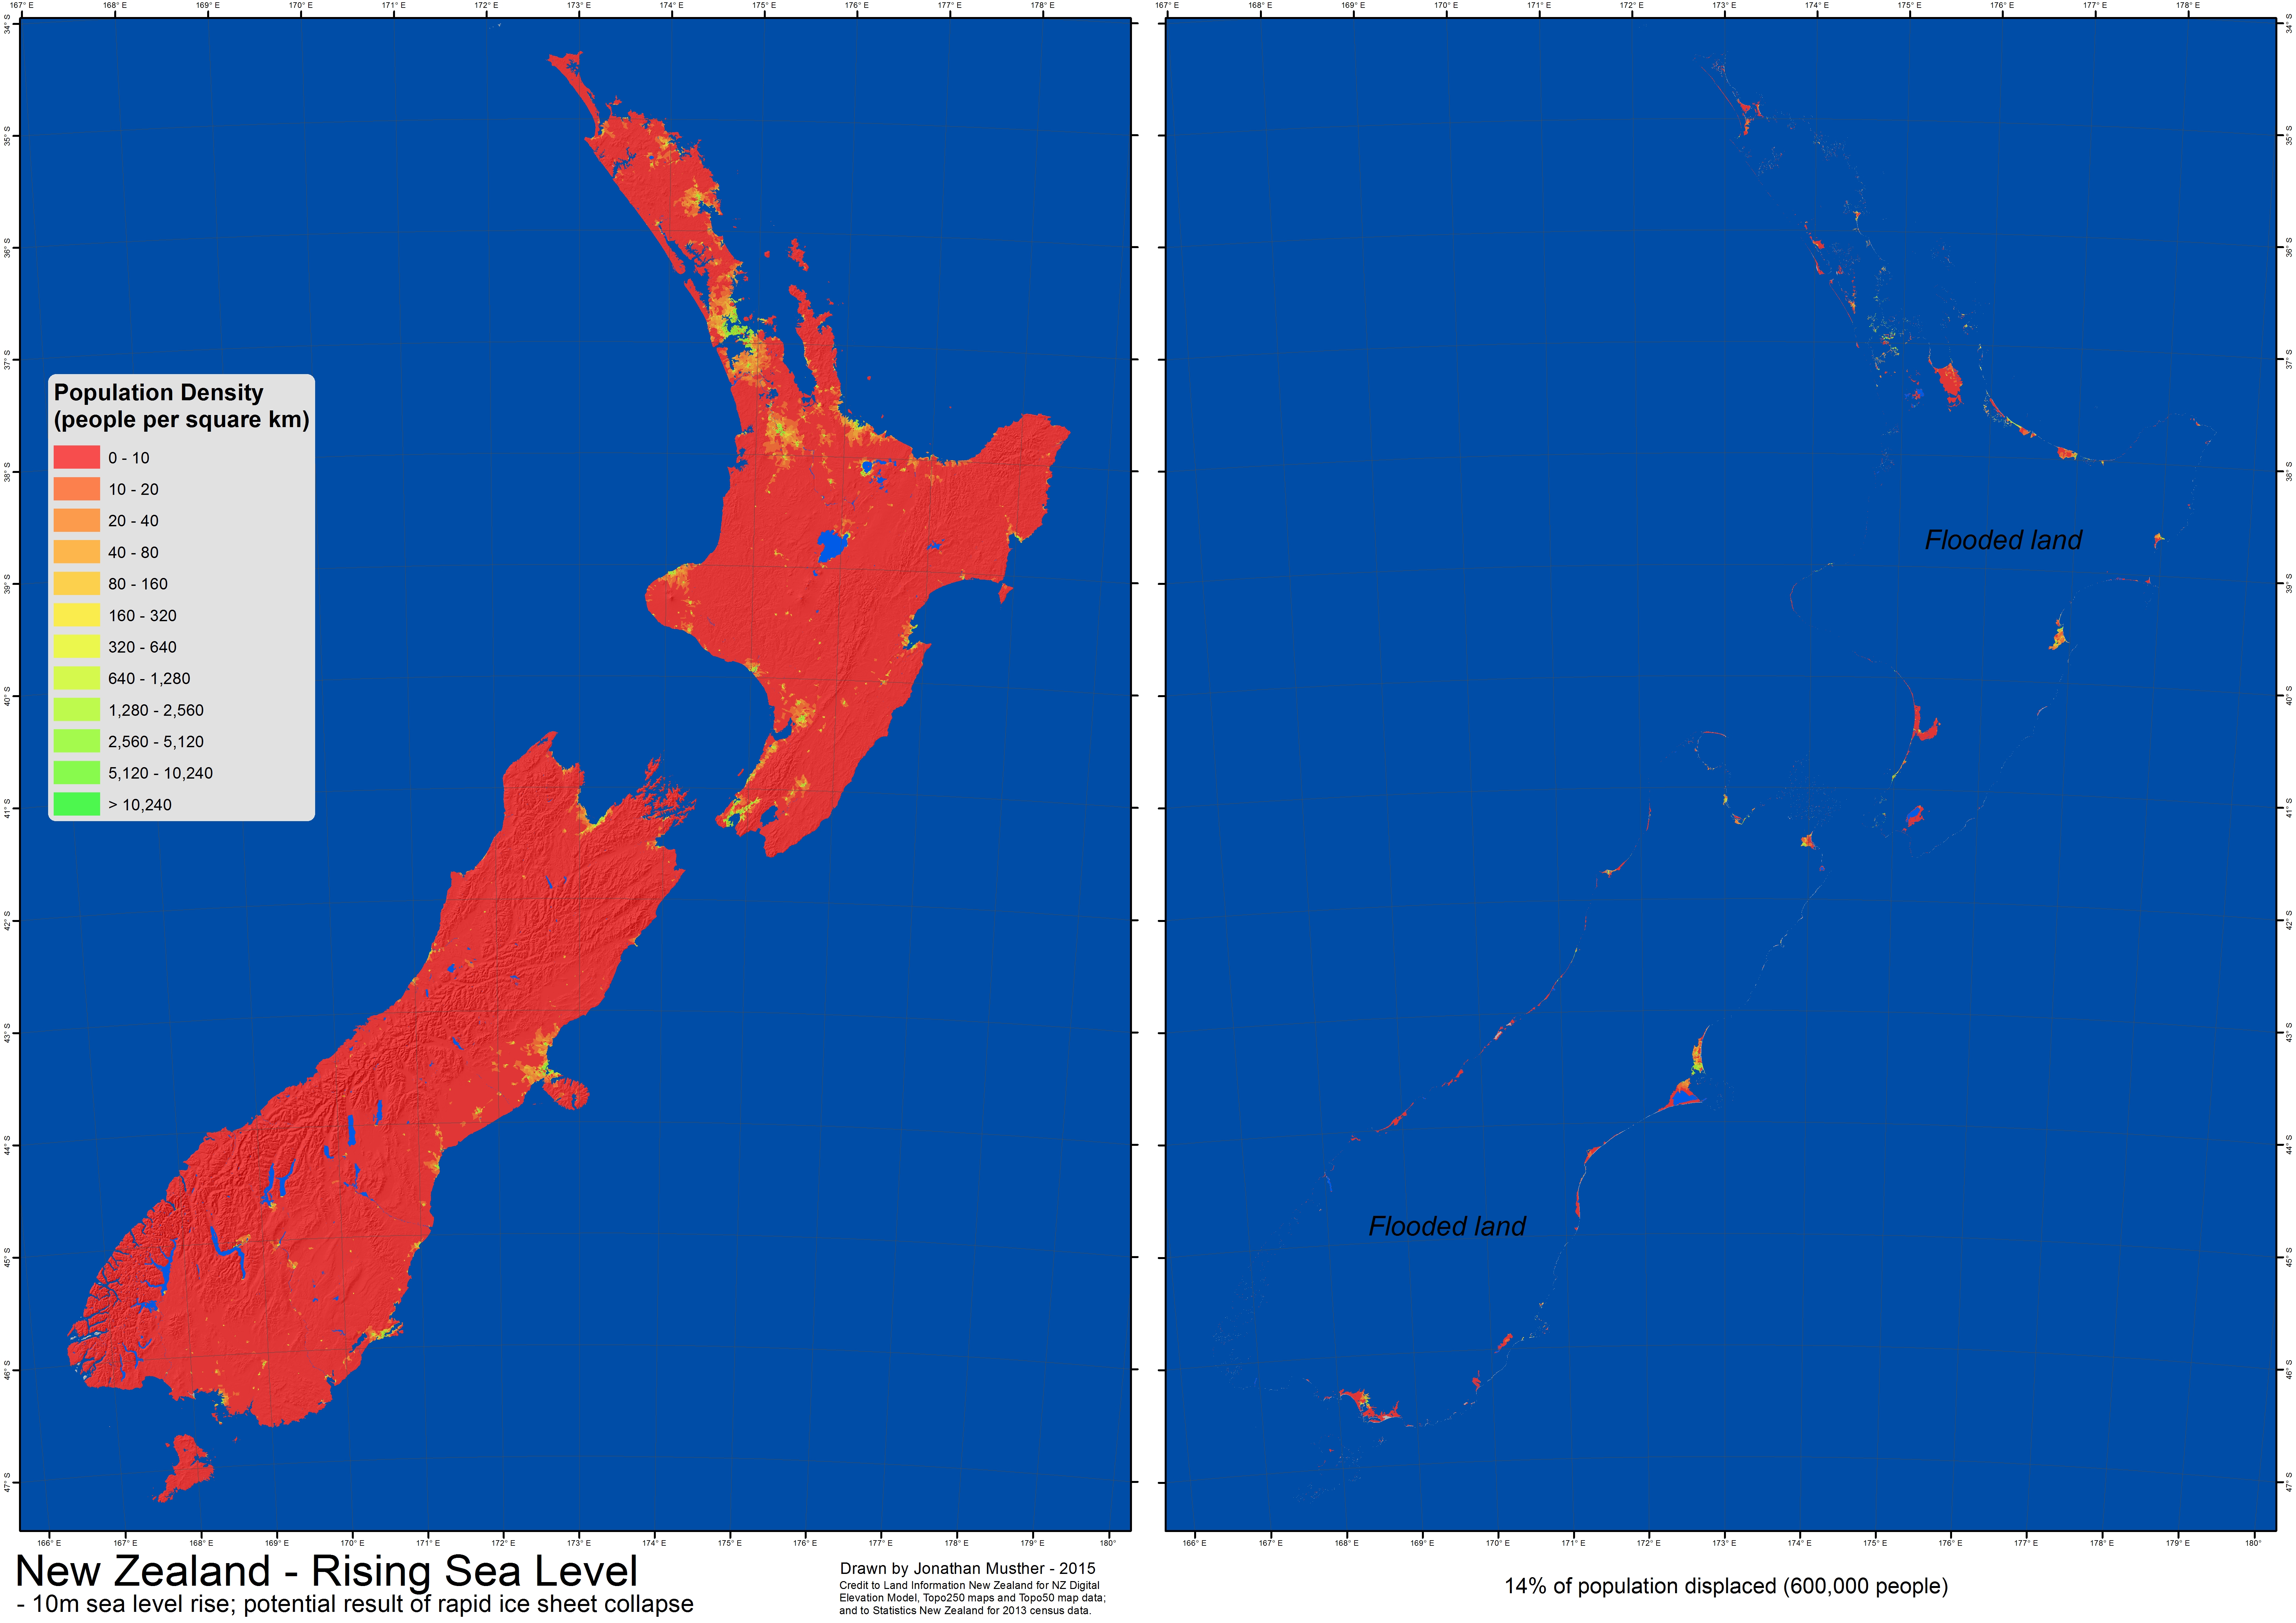
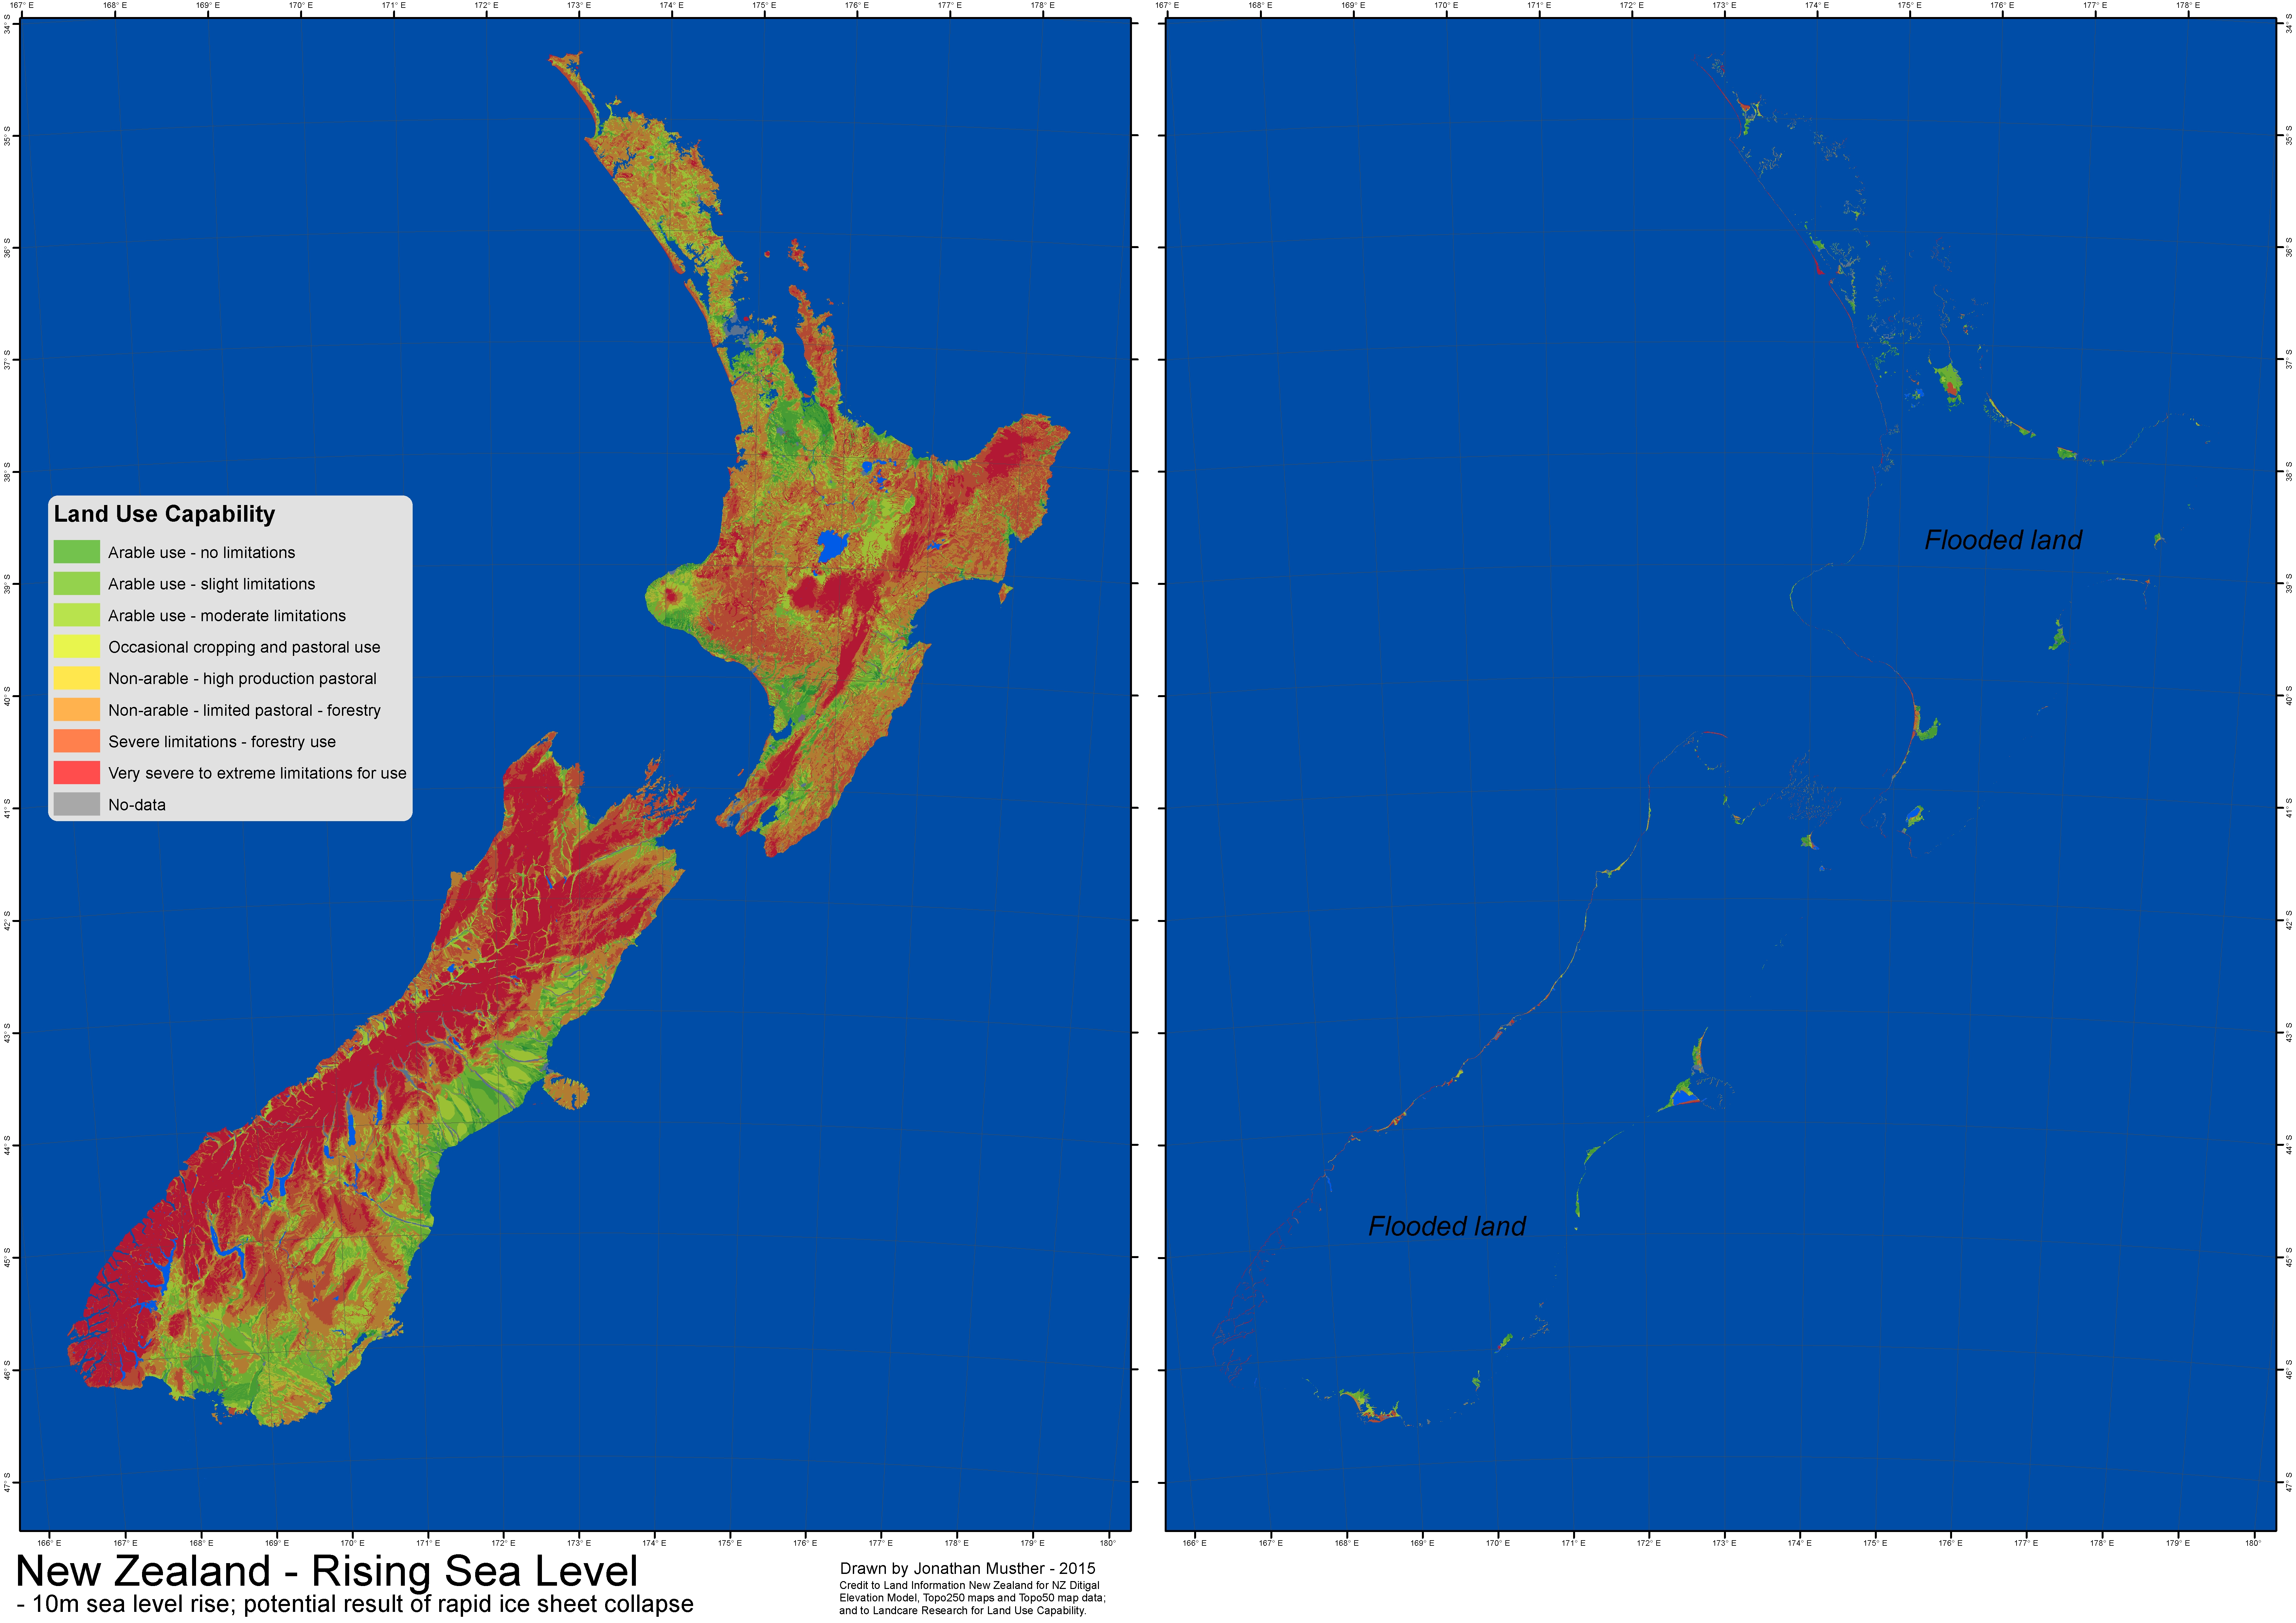
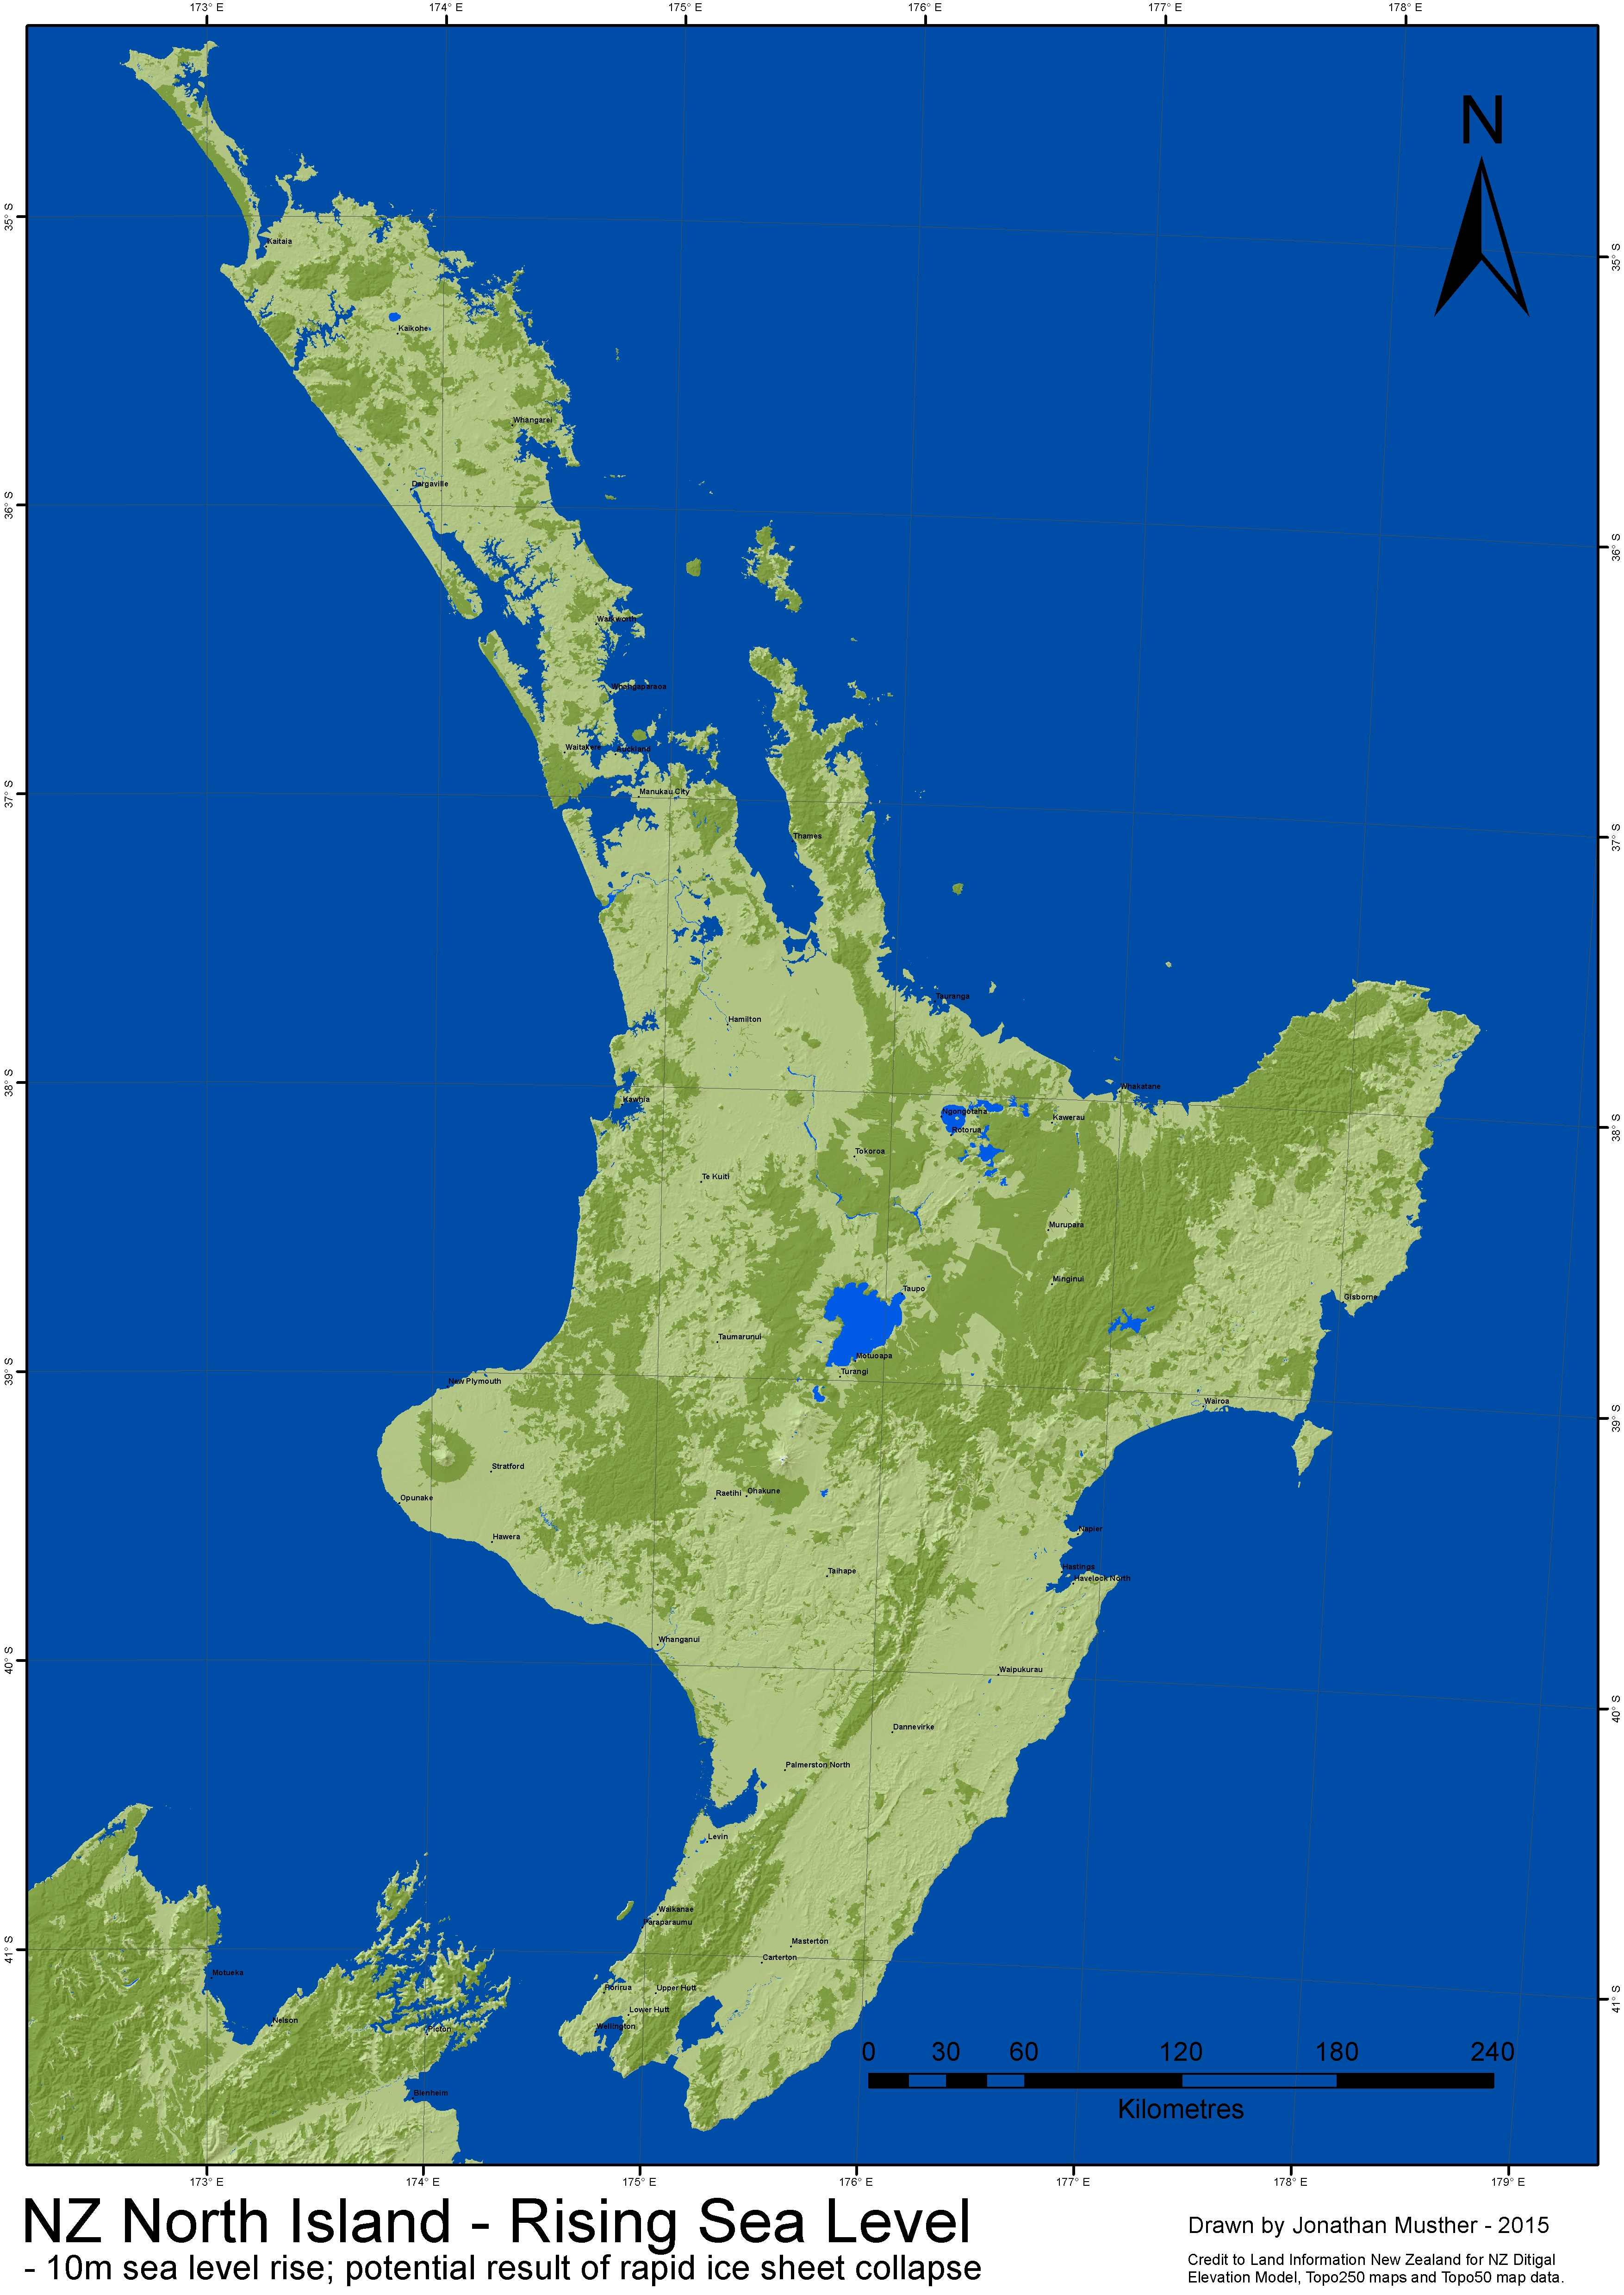
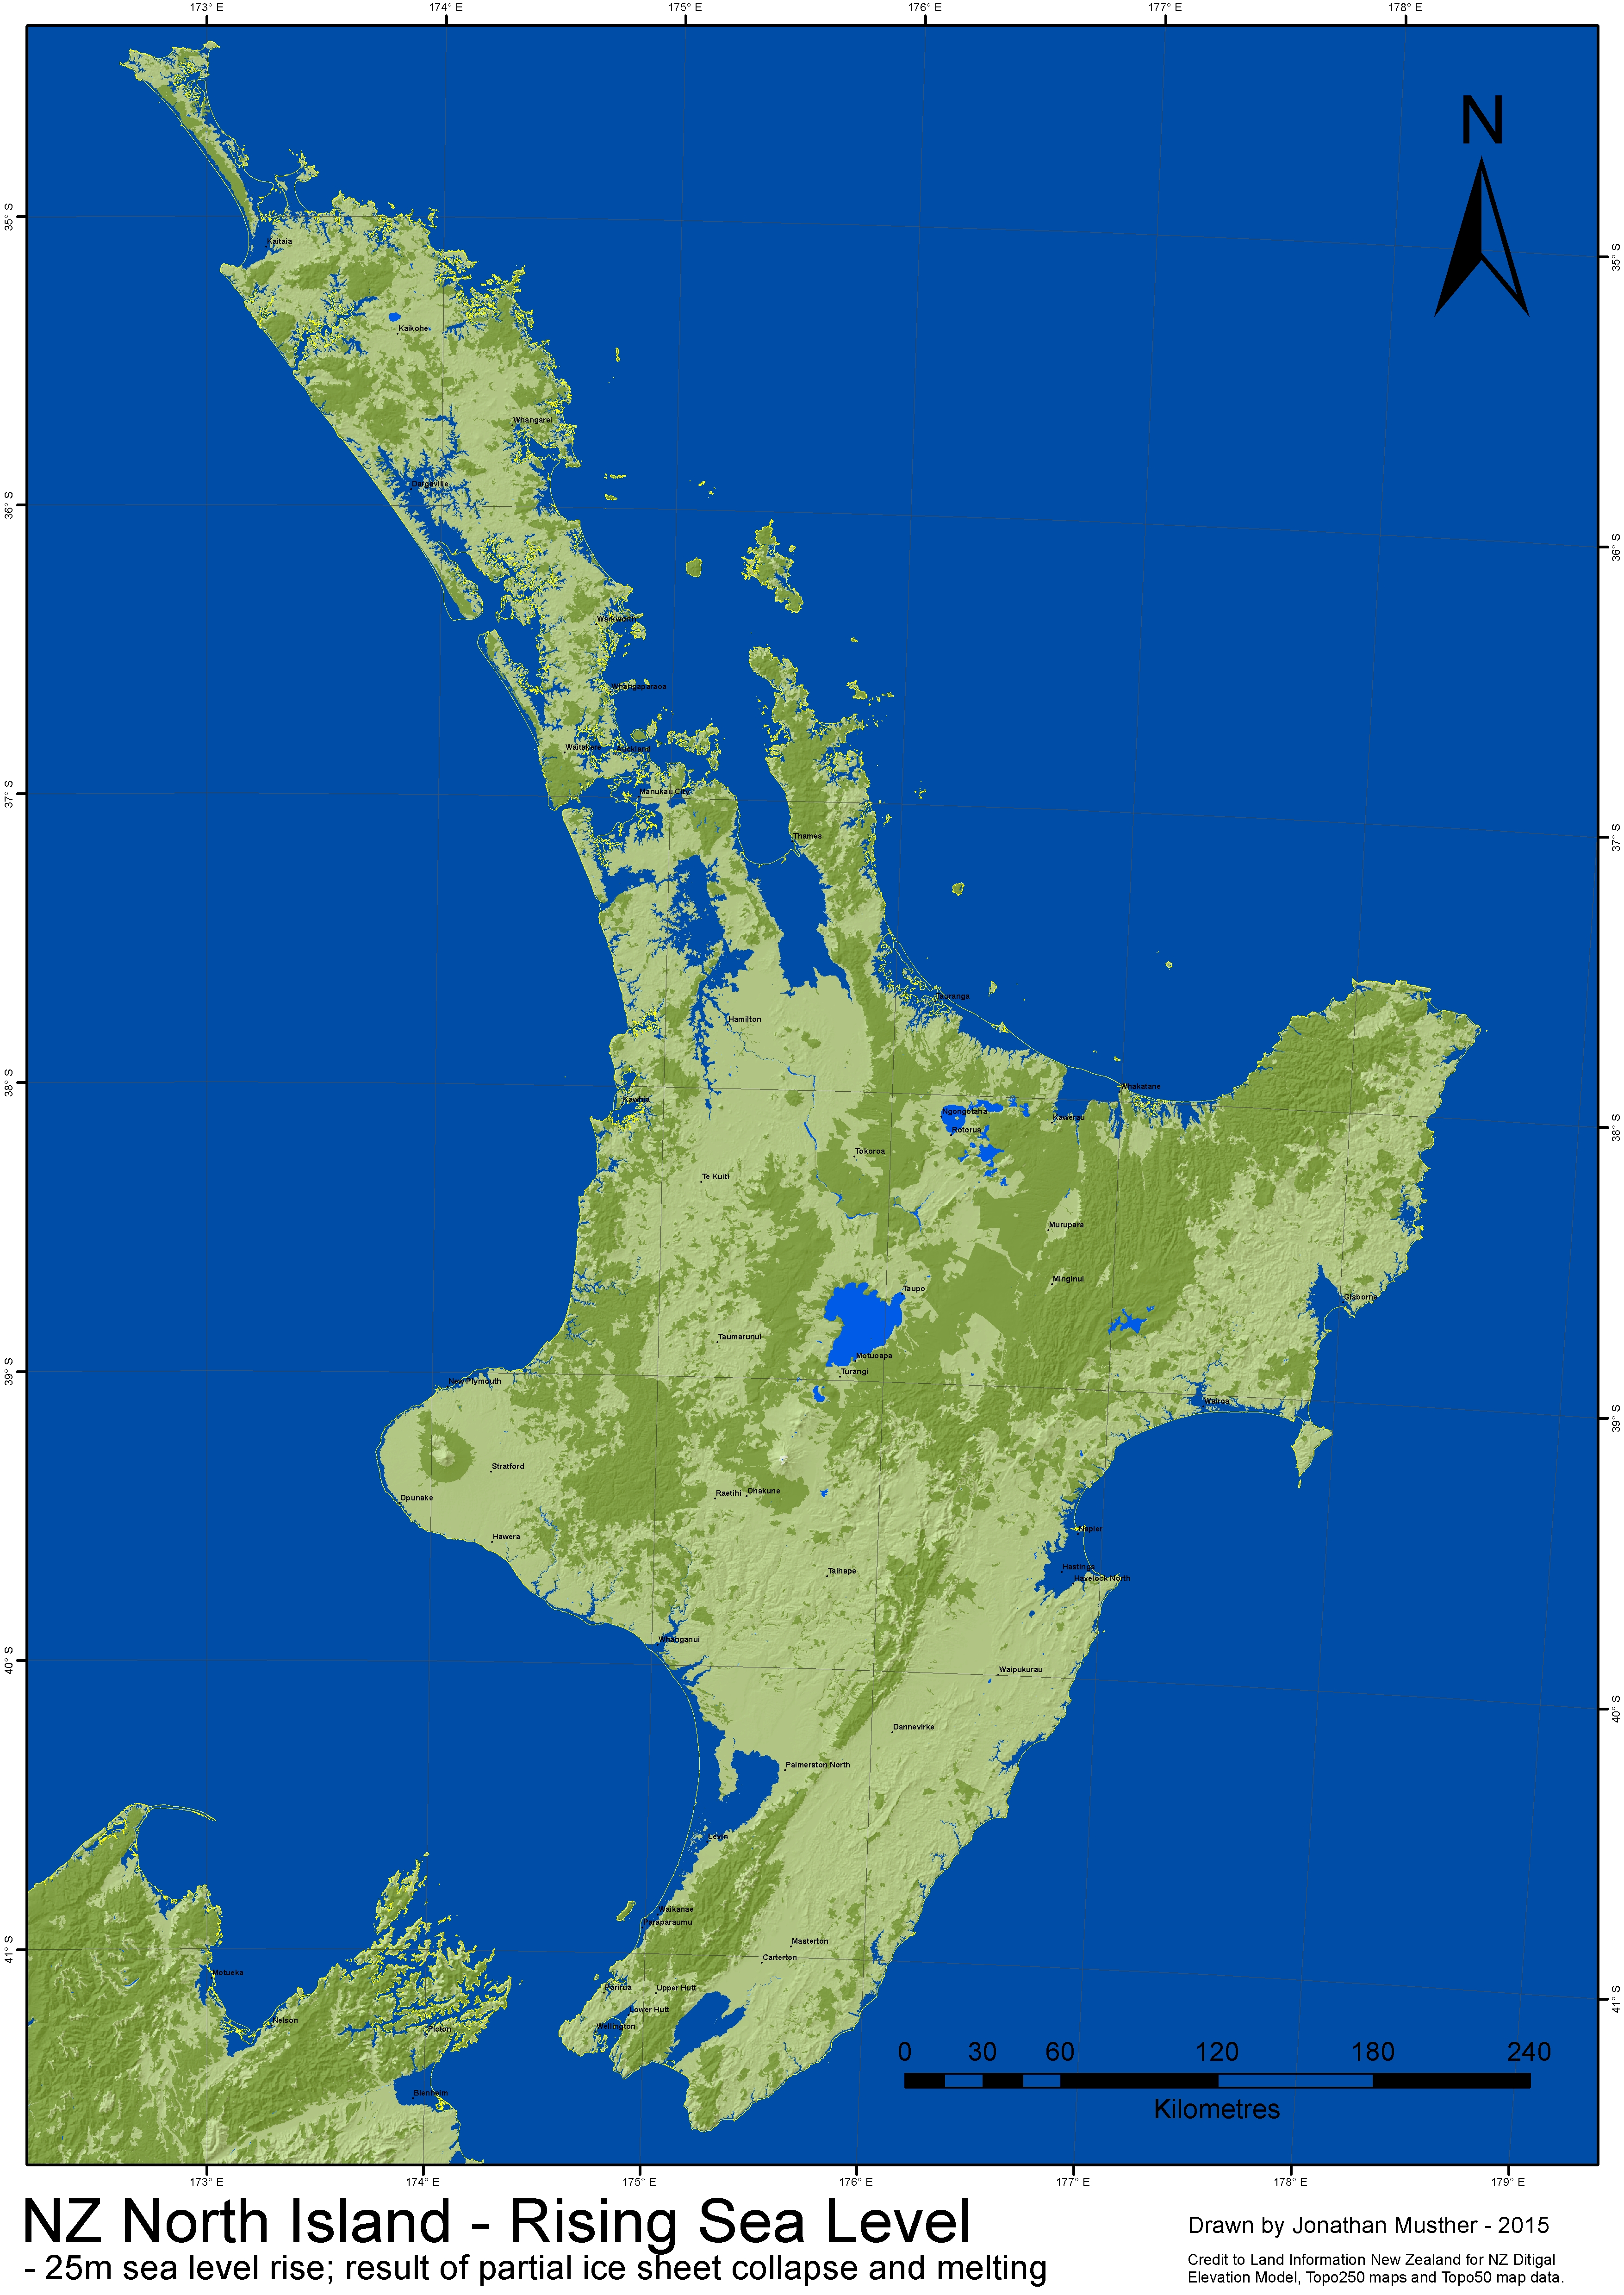
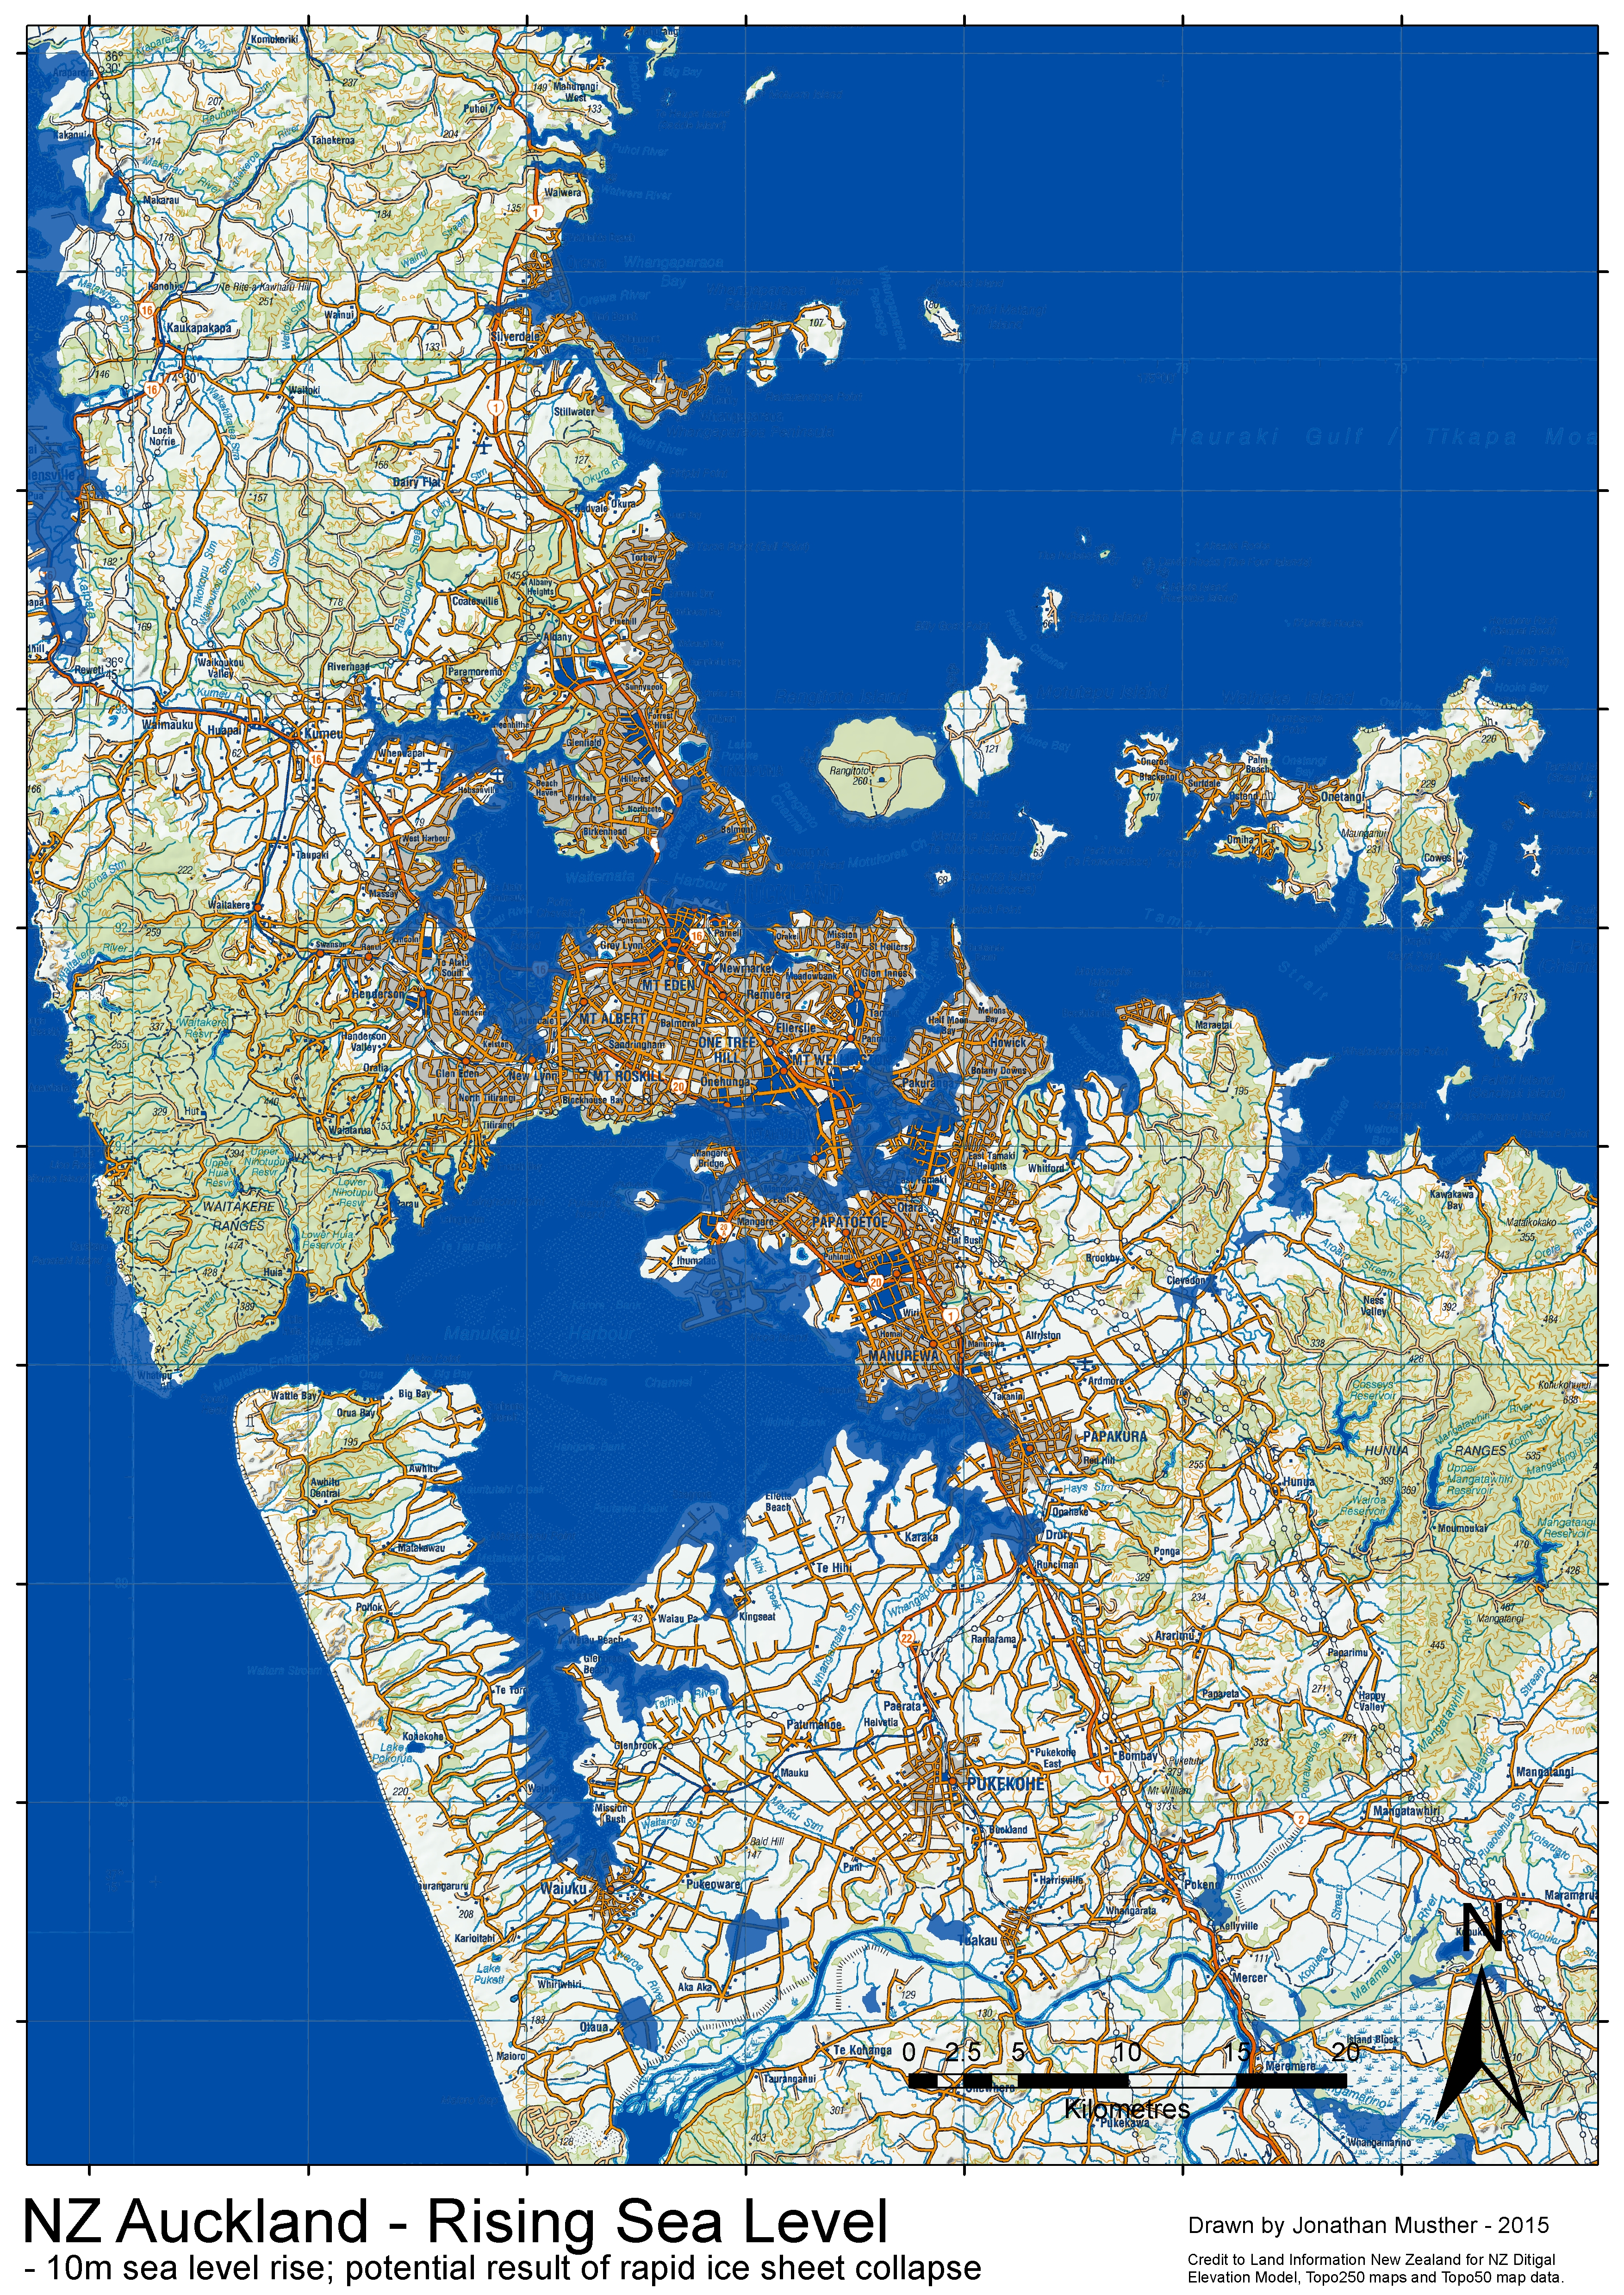
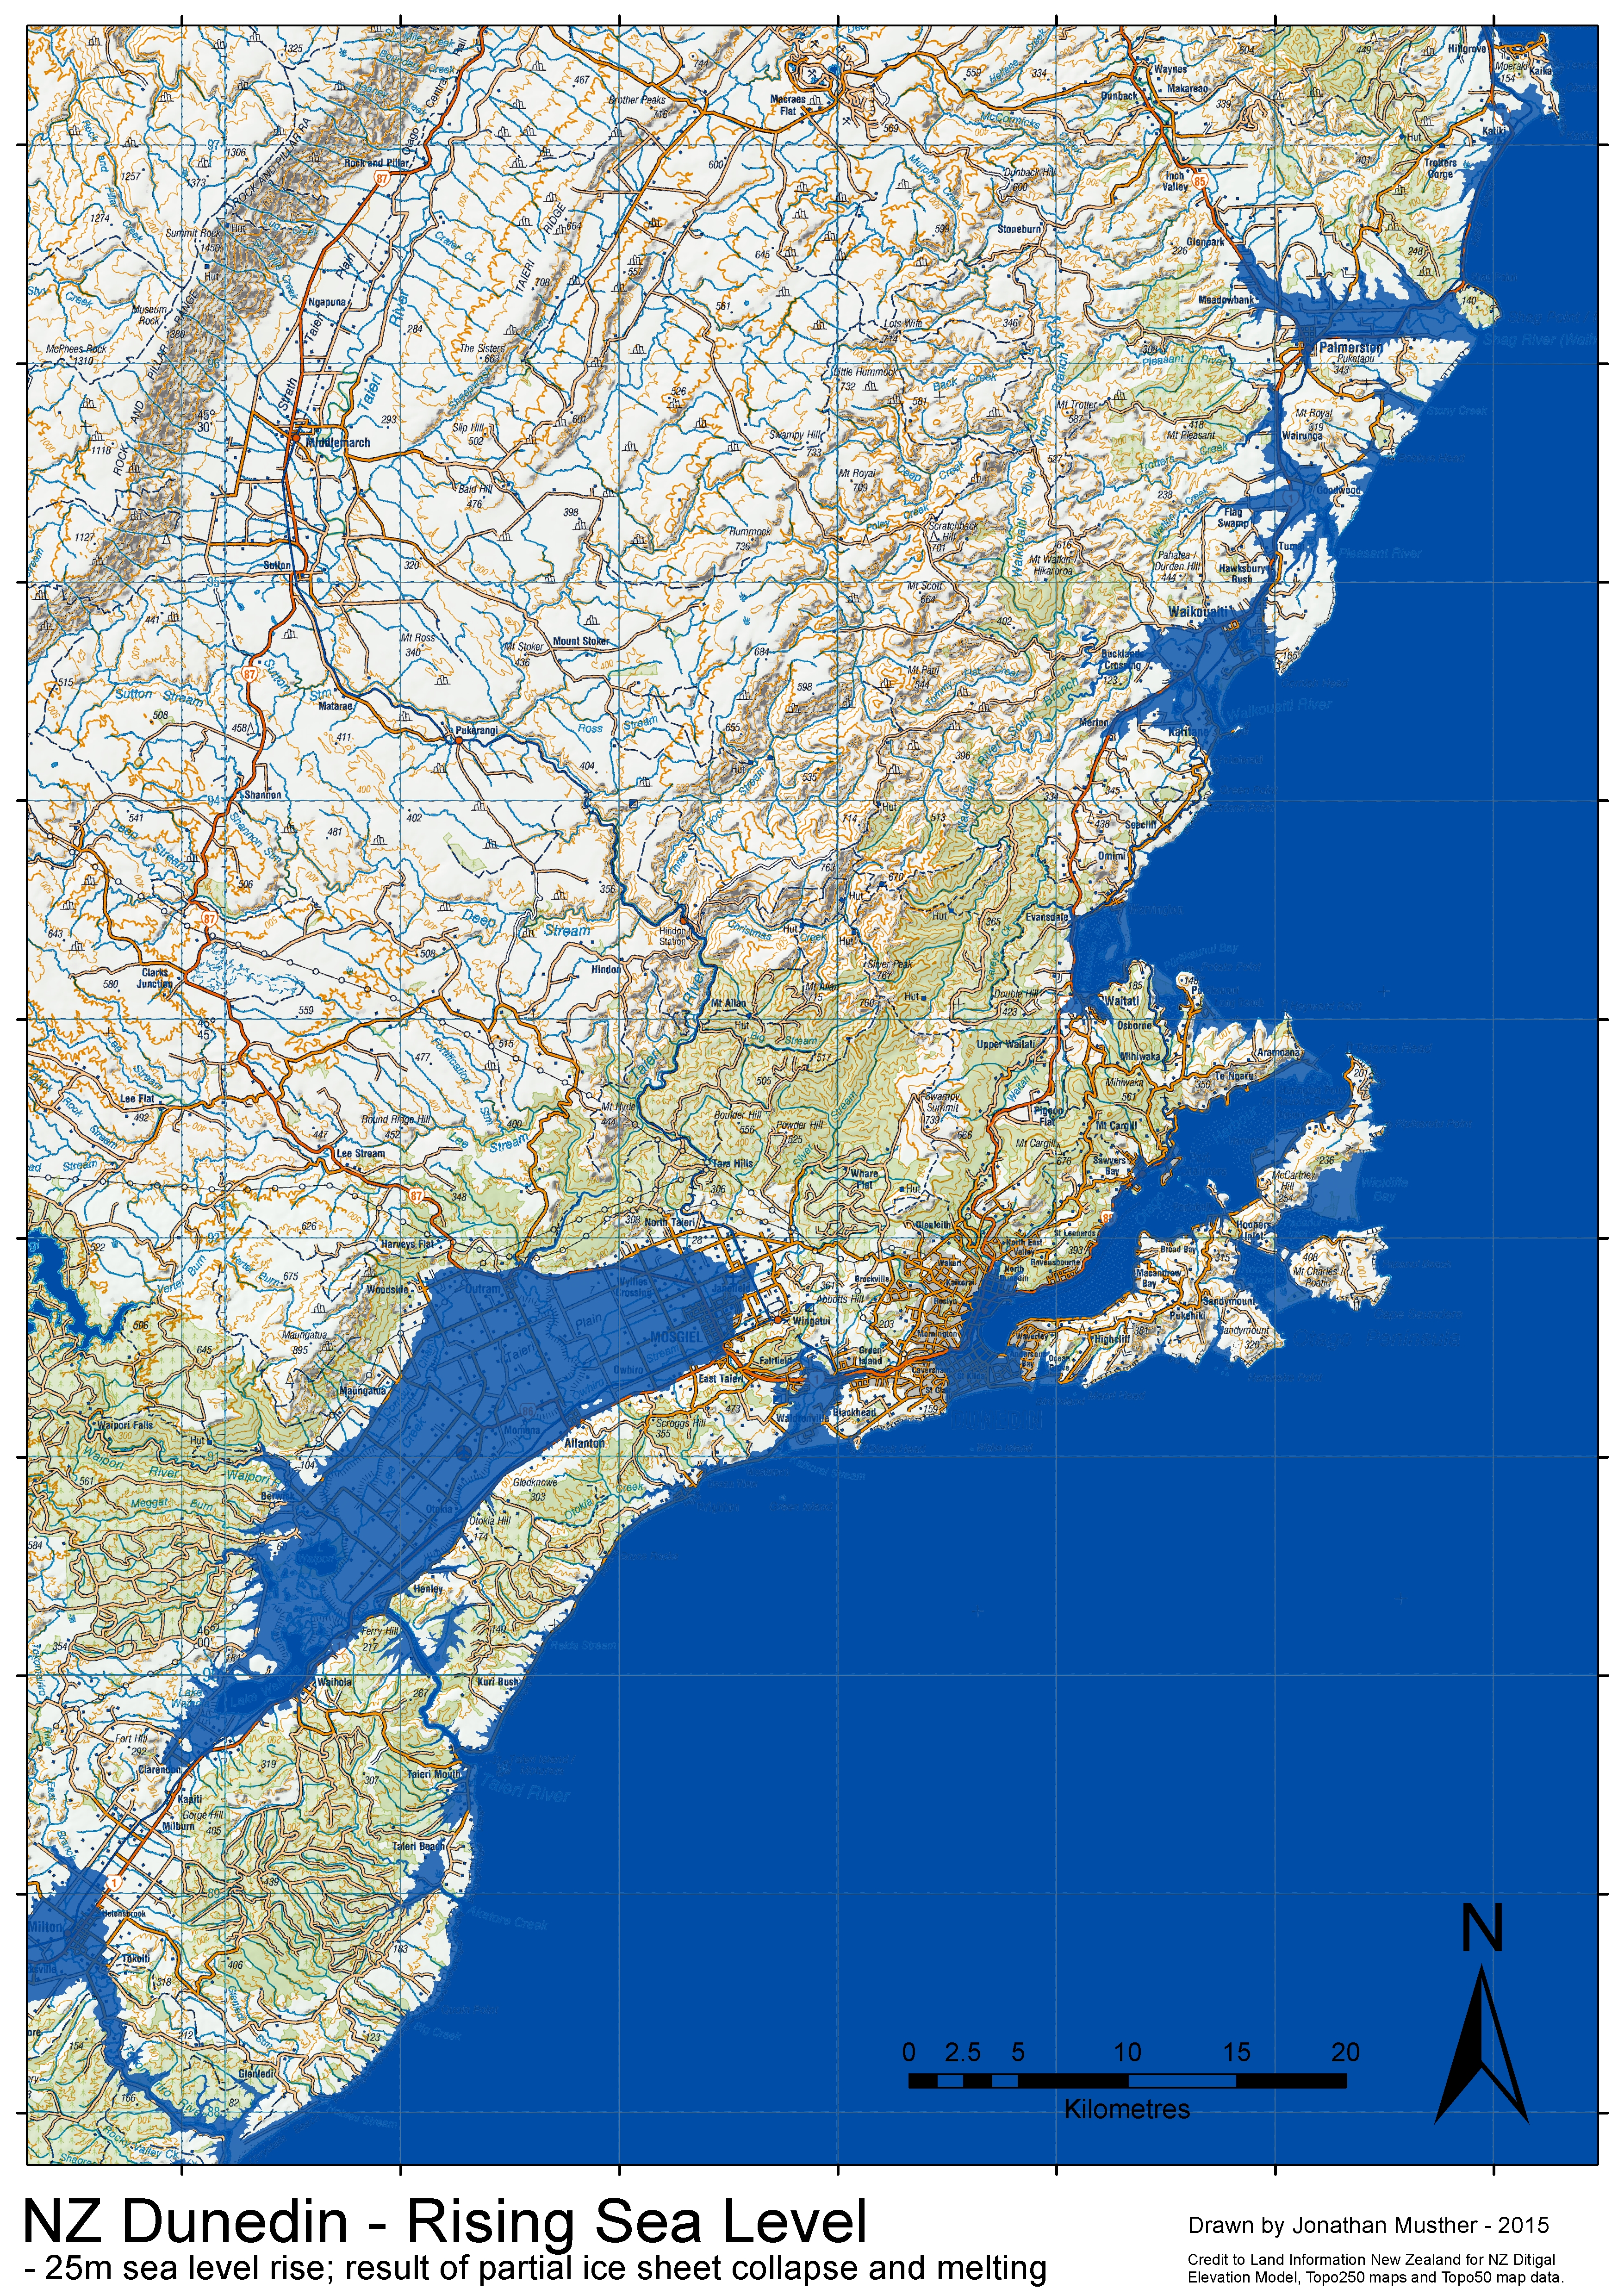
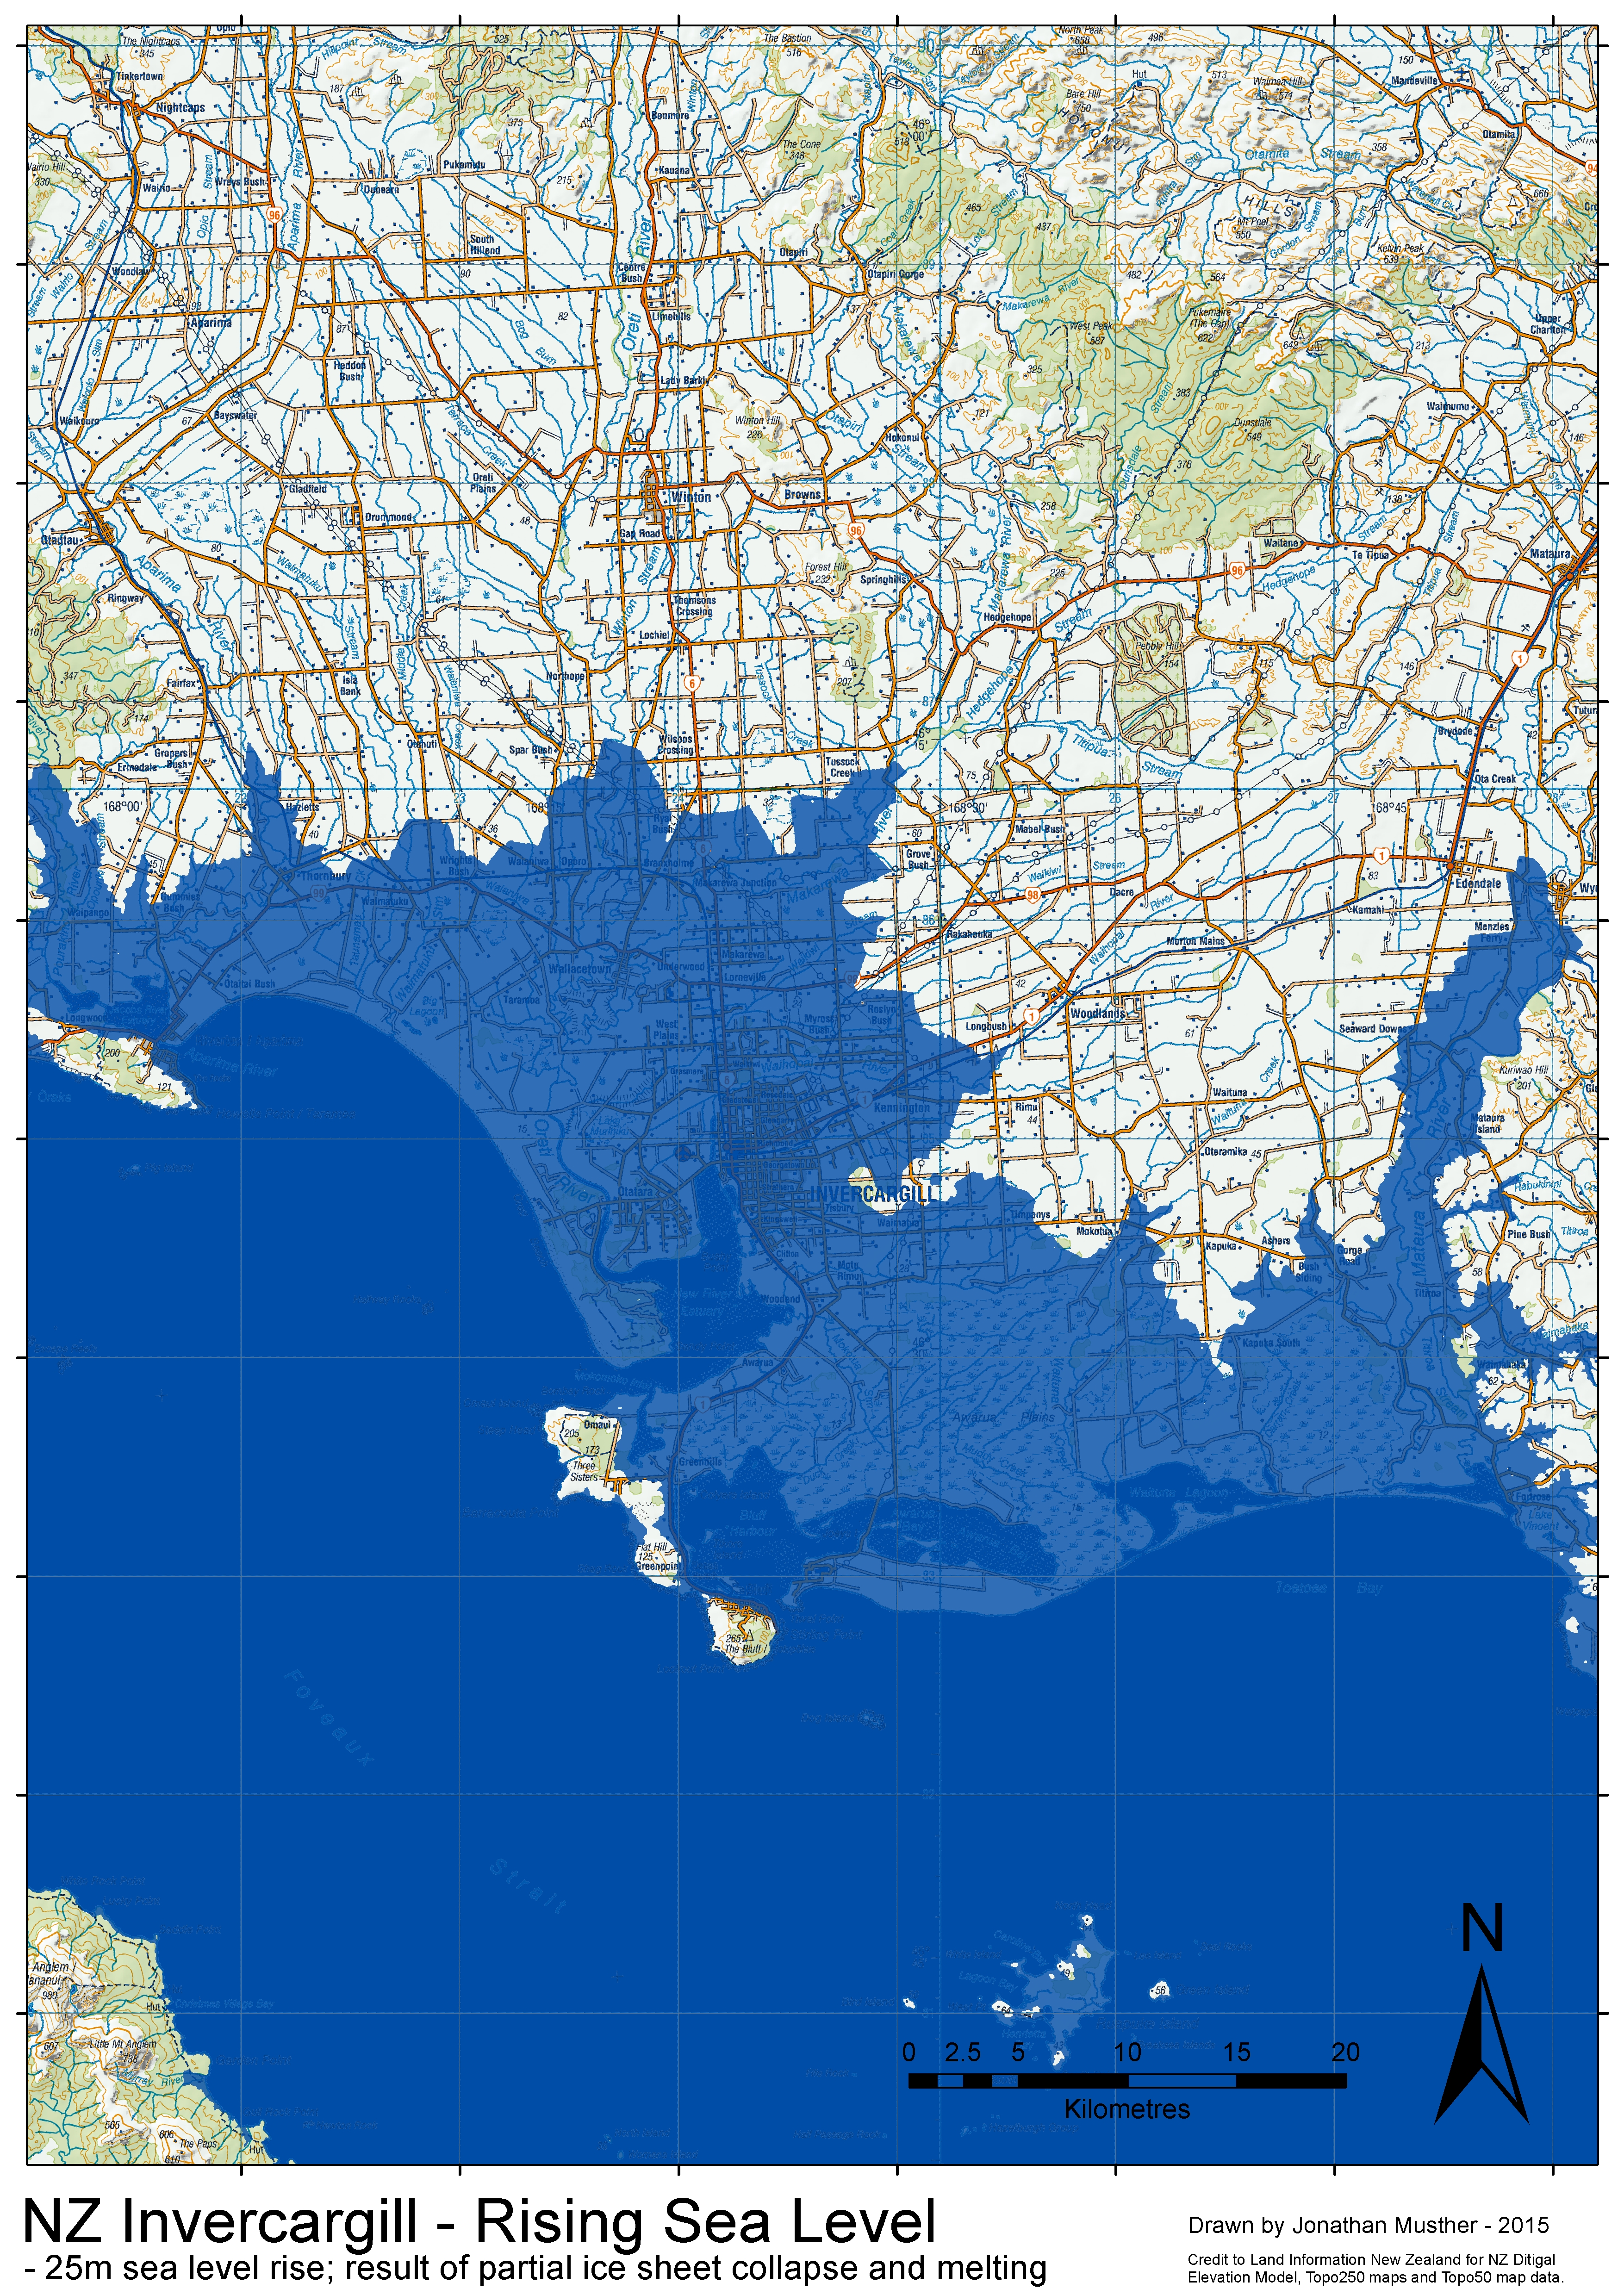
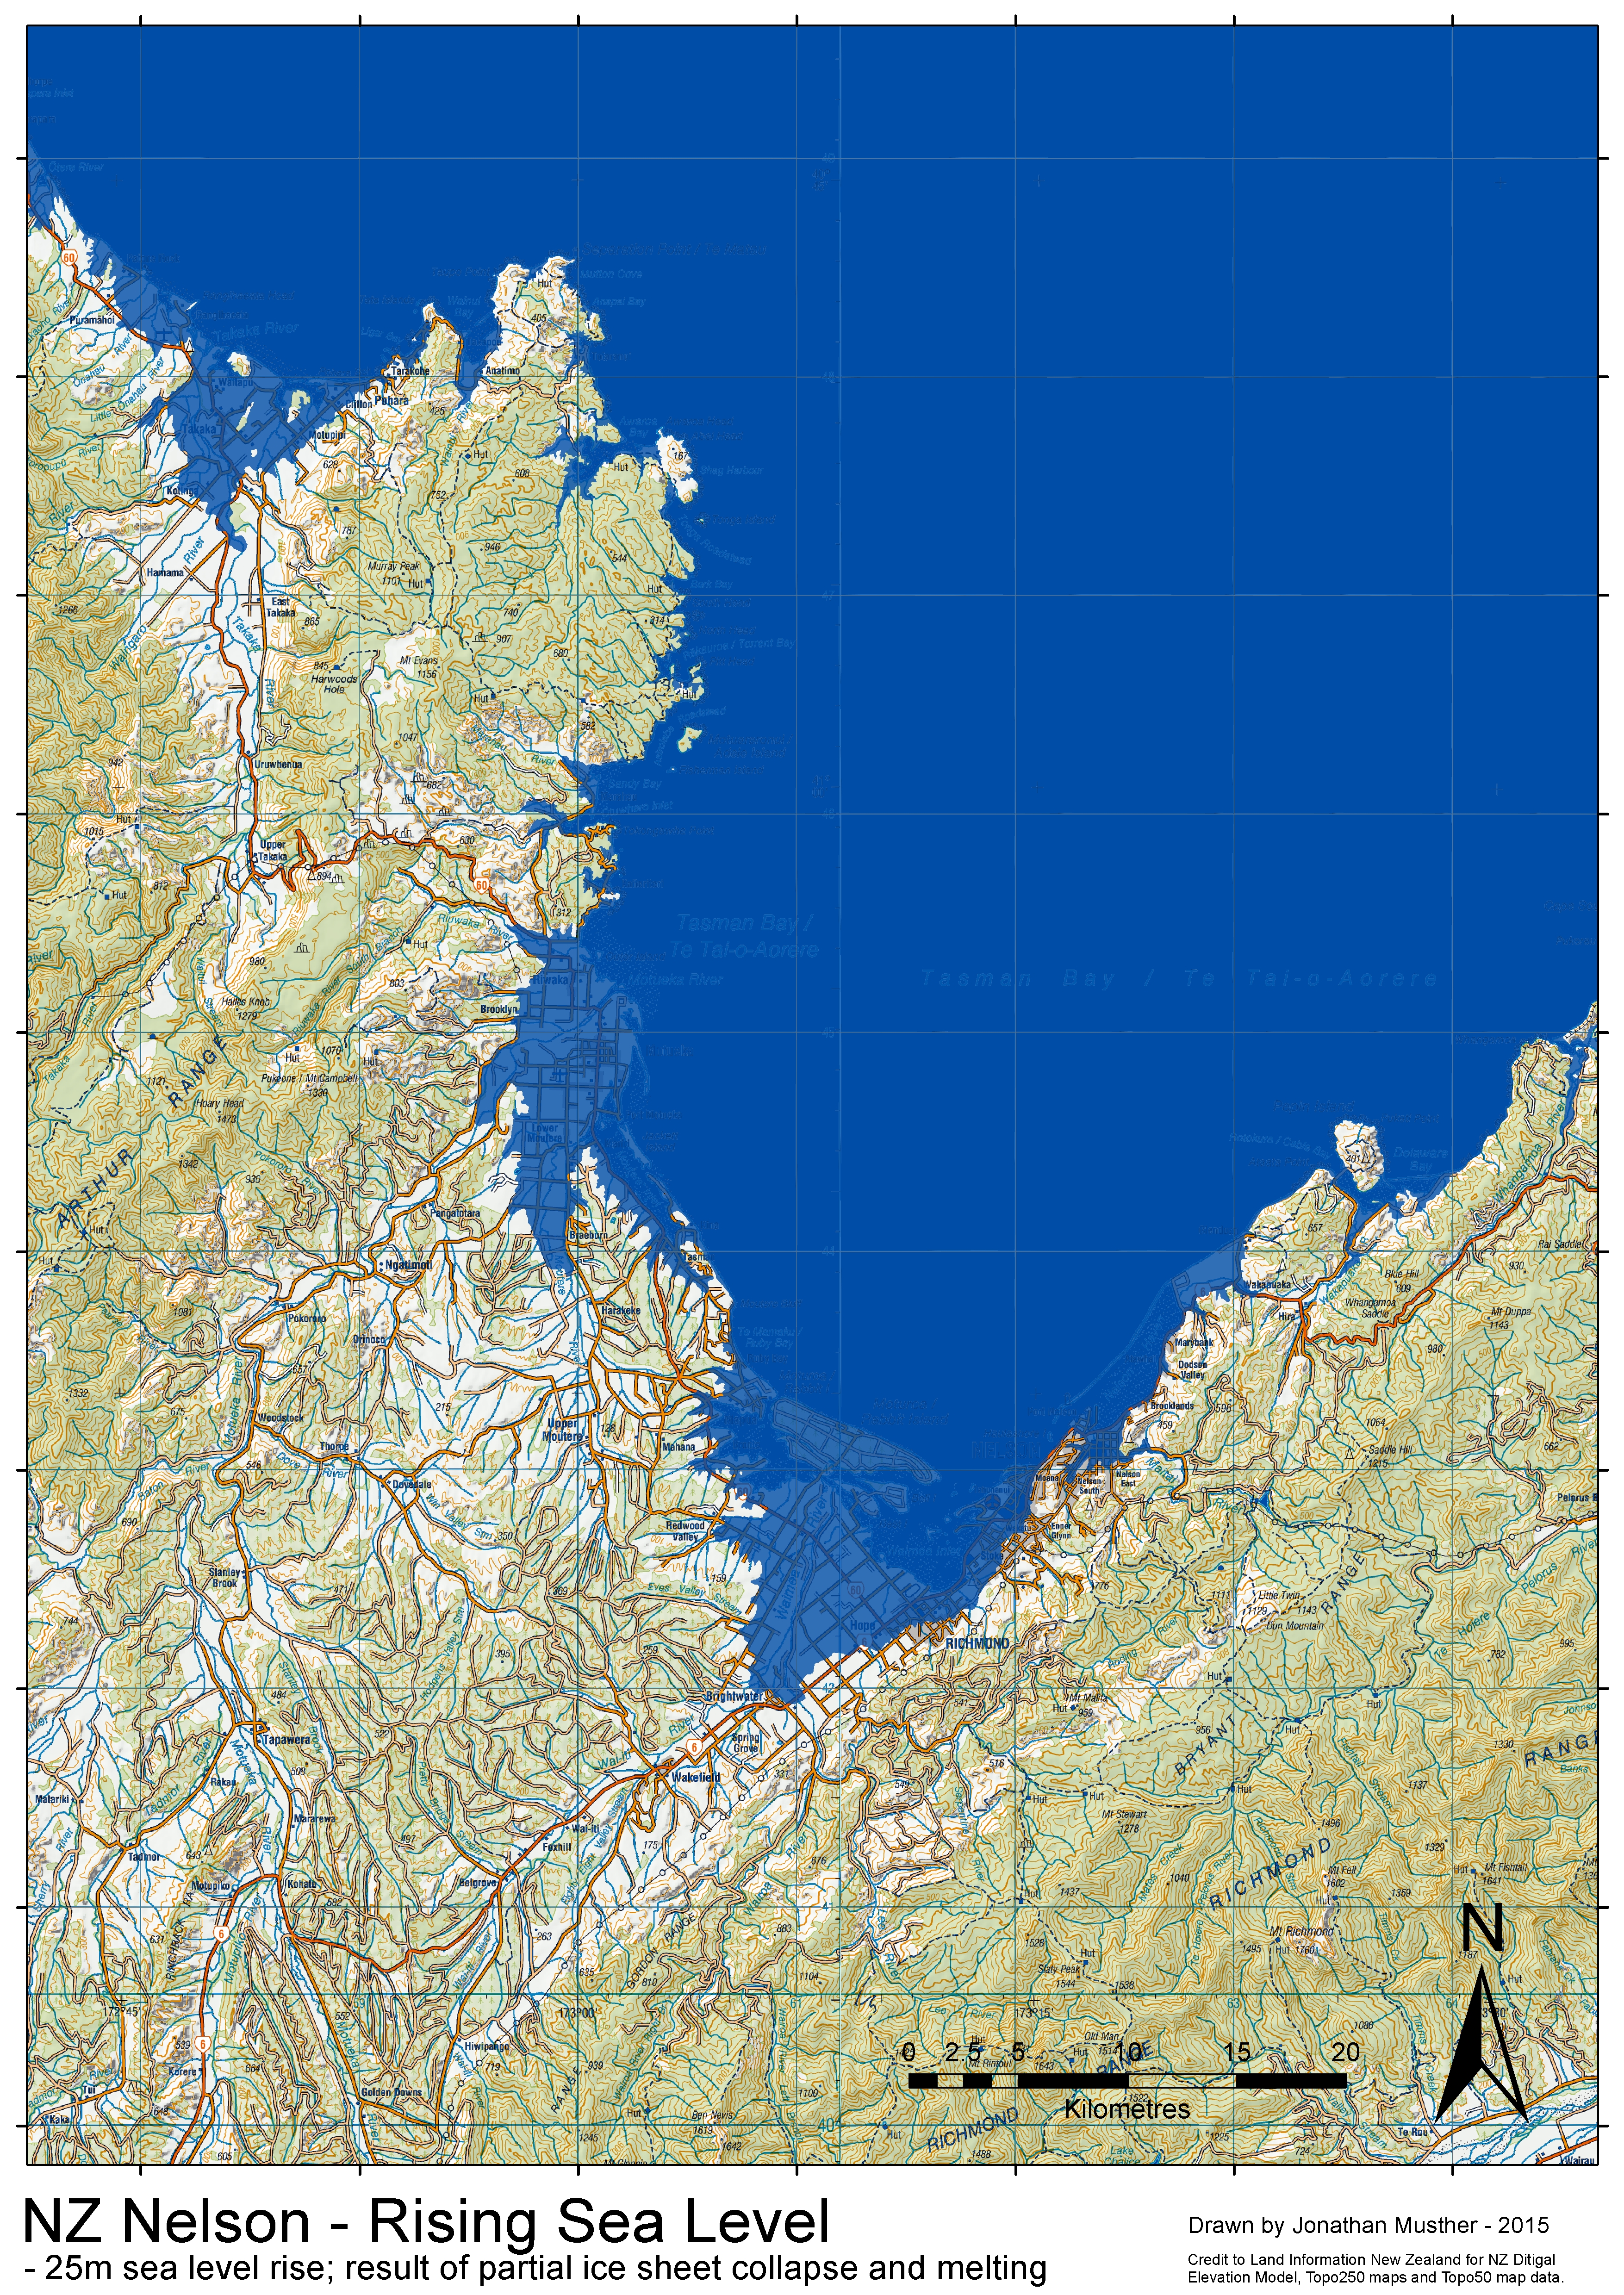
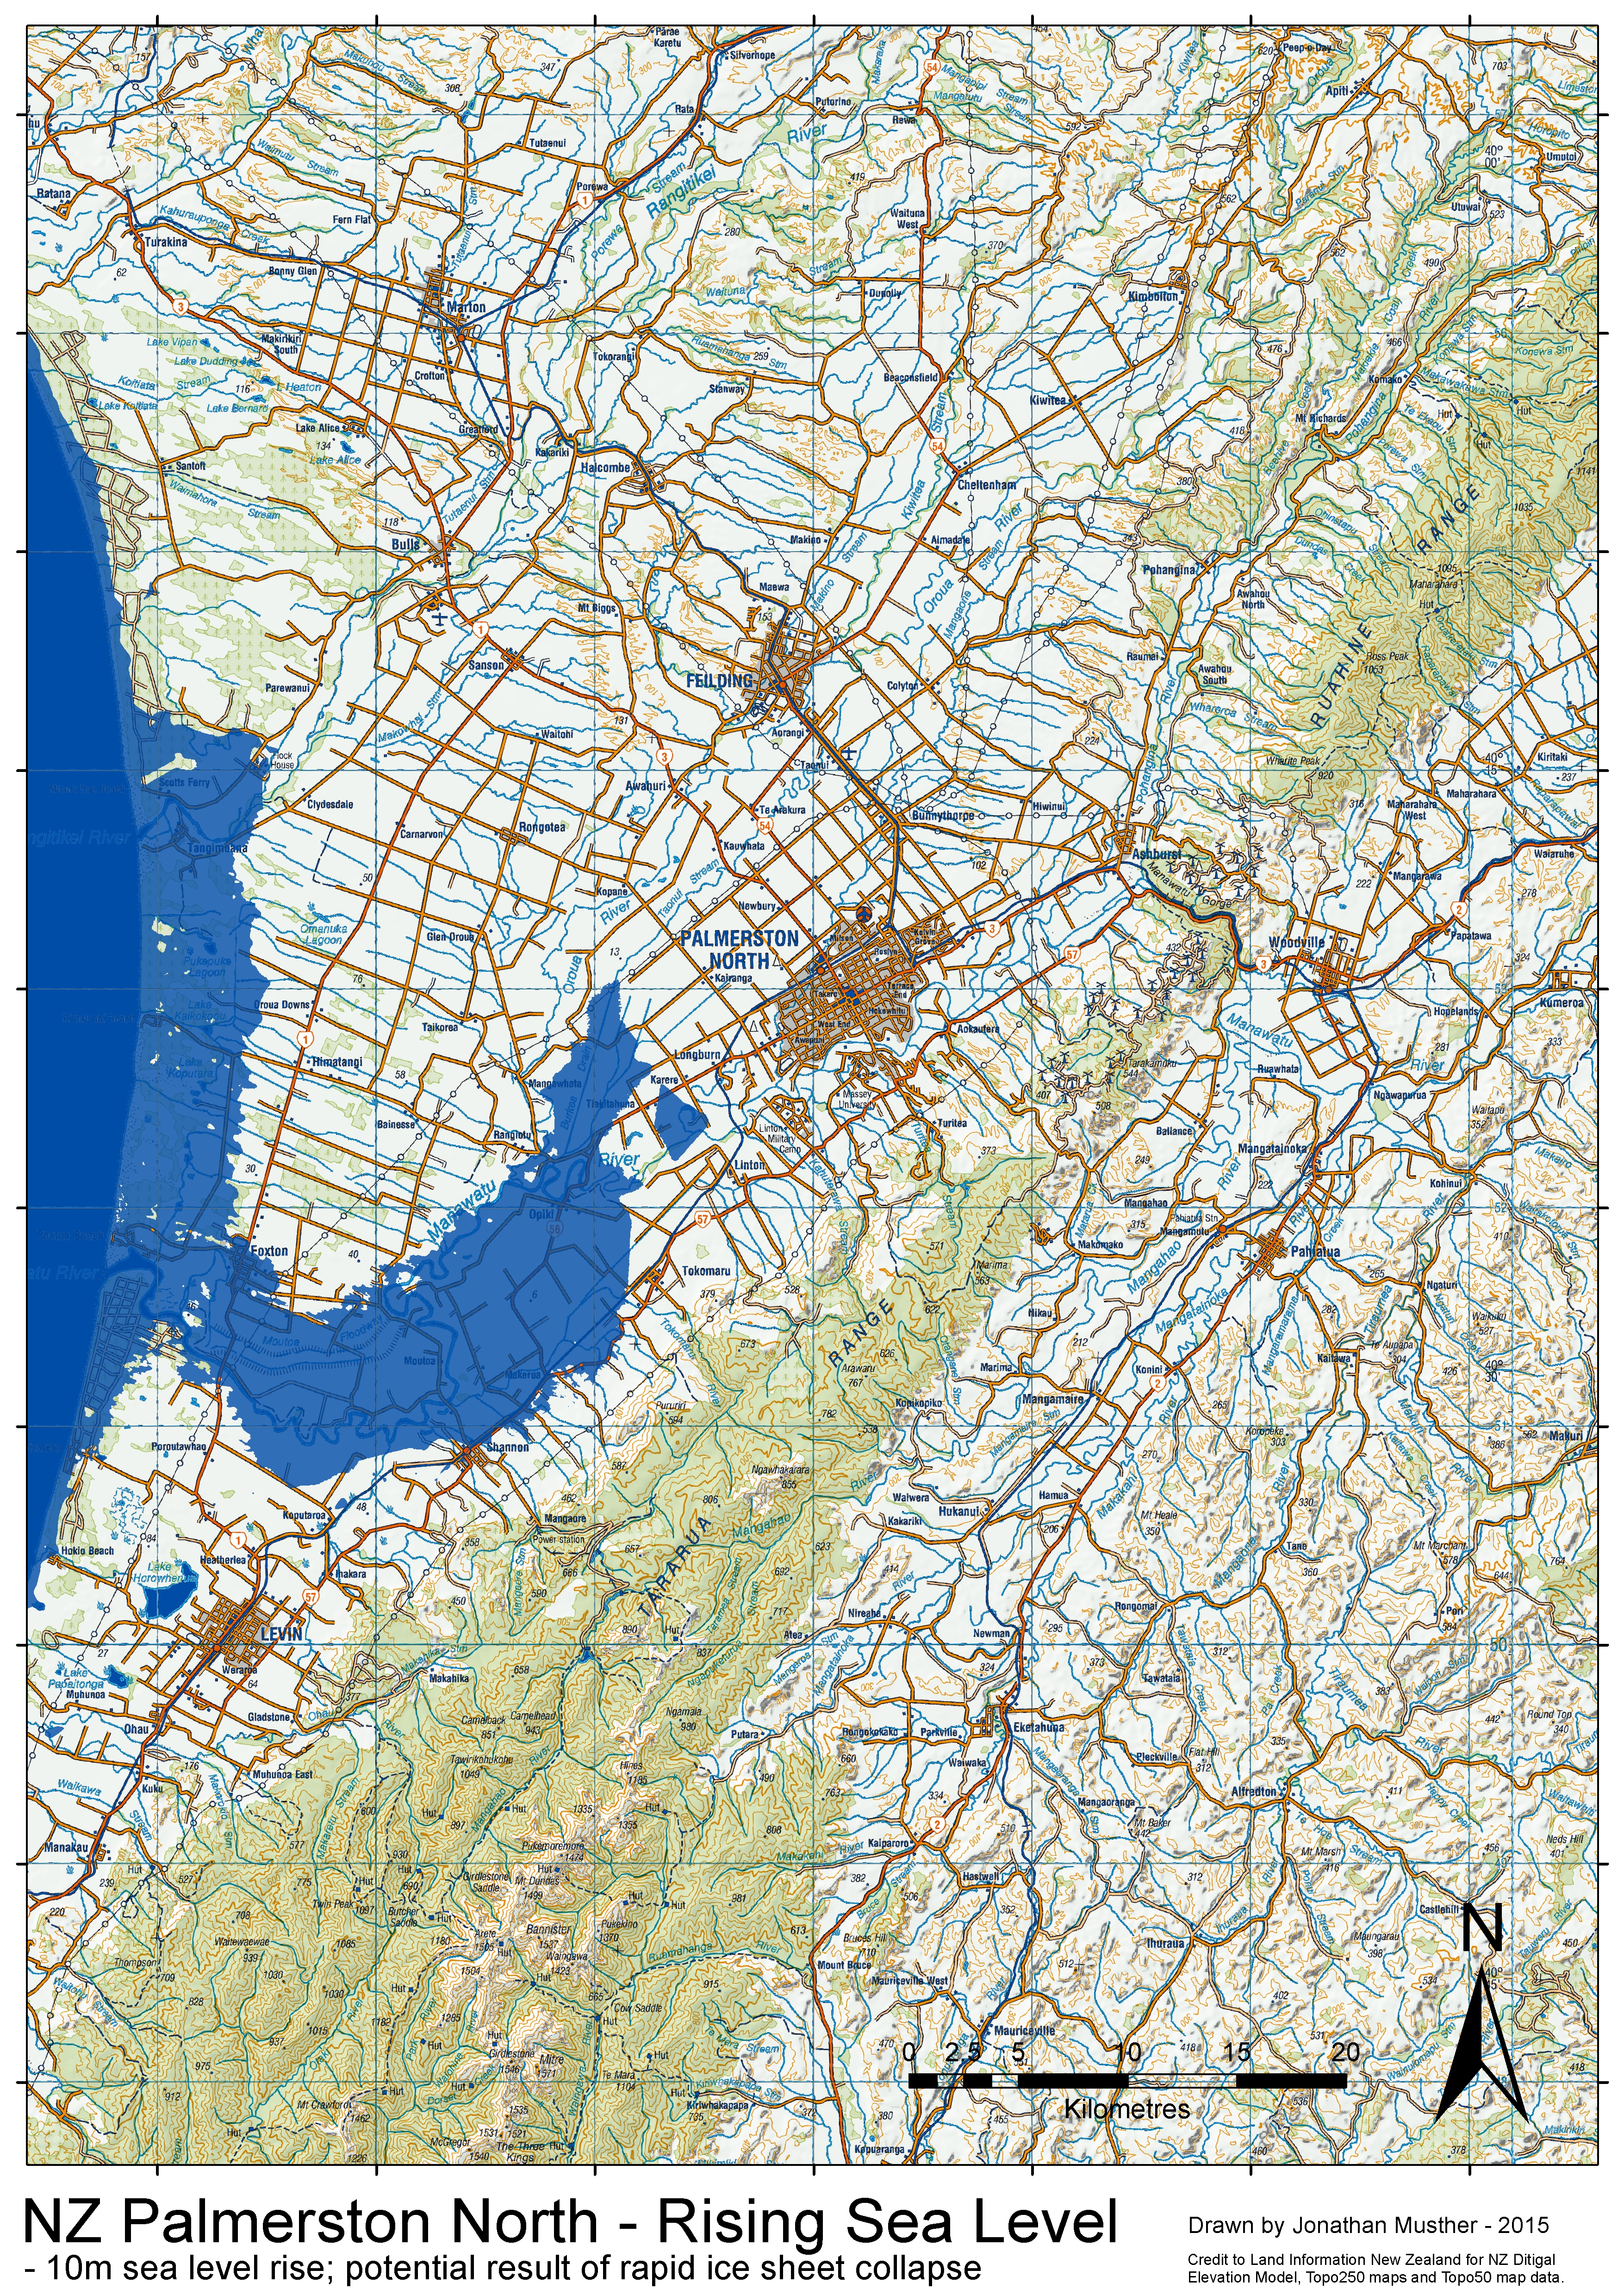
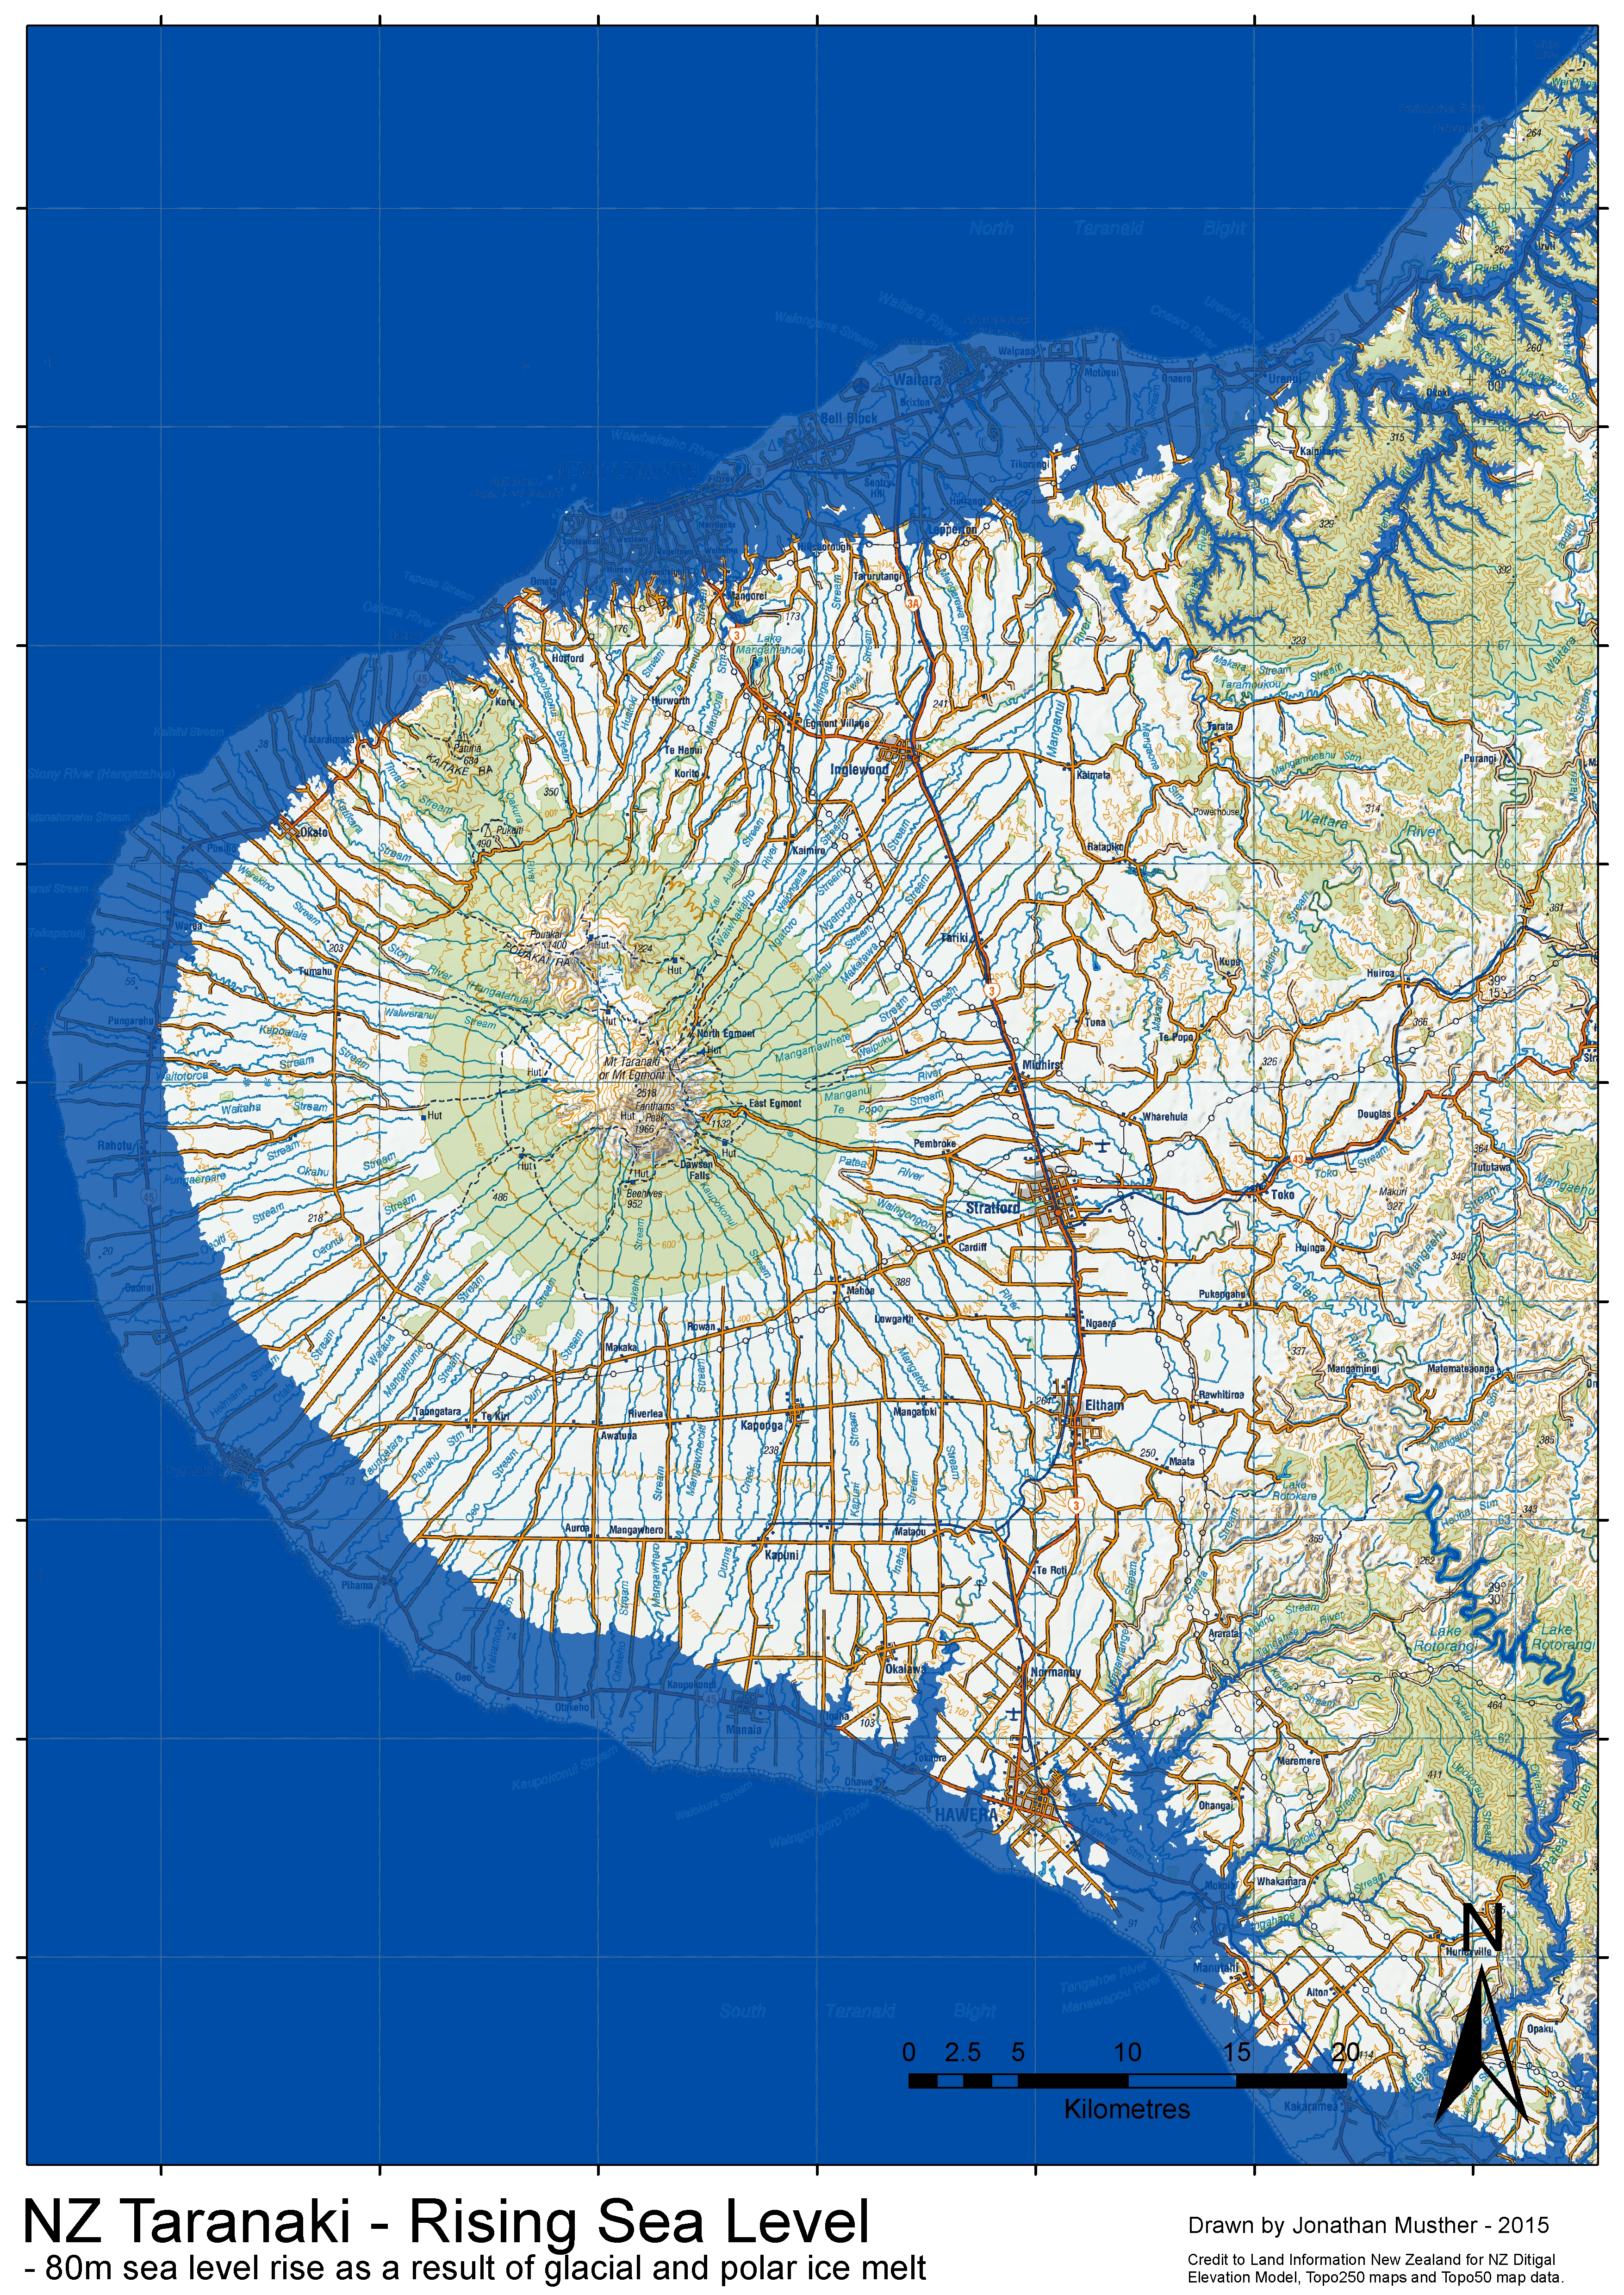
A series of maps depicting New Zealand in various sea-level rise scenarios The following maps are intended to provide an insight into the future of the New Zealand coastline as a result of sea-level rise. The visual nature of maps, and the familiarity we have with our current coastline, combine to give a very human glimpse of how generations of New Zealanders may be impacted by climate change. These maps present three scenarios; 10, 25, and 80 metre sea-level rise. The 10 metre scenario is intended to show a sea-level rise which might result from rapid collapse of any one, or a combination of parts of the Greenland, West Antarctic and East Antarctic ice sheets. Evidence suggests that these ice-sheets are becoming increasingly unstable, and while their current and potential contributions to sea-level rise remain to be determined, they are certainly capable of delivering a 10 metre rise. Ice sheet collapse is extremely difficult to predict, the 10 metre rise could happen within the 21st century, or further into the future. A 10m sea-level rise would displace 14% of New Zealand's population (600,000 people)*. The 25 metre scenario is intended to reflect a significant but far from complete melting of the Earth’s freshwater ice. It is likely the Greenland ice sheet would be largely melted, but Antarctica would retain over half of its present ice. This scenario would likely follow the 10 metre rise as the ice sheets continued to collapse and melt. The timeframe for this scenario is extremely difficult to predict. While a 25 metre sea-level rise could occur within the 21st century, it is more likely that it would be in future centuries. A 25m sea-level rise would displace 43% of New Zealand's population (1.8 million people)*. The 80 metre scenario represents complete melting of the Earth’s ice sheets and major glaciers. This would most likely require a significant warming of the climate (at least 5 degrees). While this scenario would probably be played out over several centuries, it is certainly possible if global climate warming continues. More recent estimations of the ice contained in the antarctic ice sheets suggest that this scenario should use a sea level rise of ~70m. An 80m sea-level rise would displace 80% of New Zealand's population (3.4 million people)*. *Based on 2013 census data. Final thoughts: Estimates of sea-level rise are extremely complex, but ongoing research and increased understanding is leading us to believe that widely publicised estimates (such as those from IPCC reports) are far too conservative. Historical evidence suggests that ice sheets may respond to climate changes very rapidly, and recent data show increased rates of melting and growing instability. Predicting climate change is phenomenally difficult; we are now well outside the sphere of collective of human experience and expertise. Sea-level rise is happening now, and its rate will likely take us by surprise.

New Zealand Sea-Level Rise Maps by Jonathan Musther are licensed under a Creative Commons Attribution-NoDerivatives 4.0 International License.
Contact: jon@musther.net +64 (0) 27 749 6350